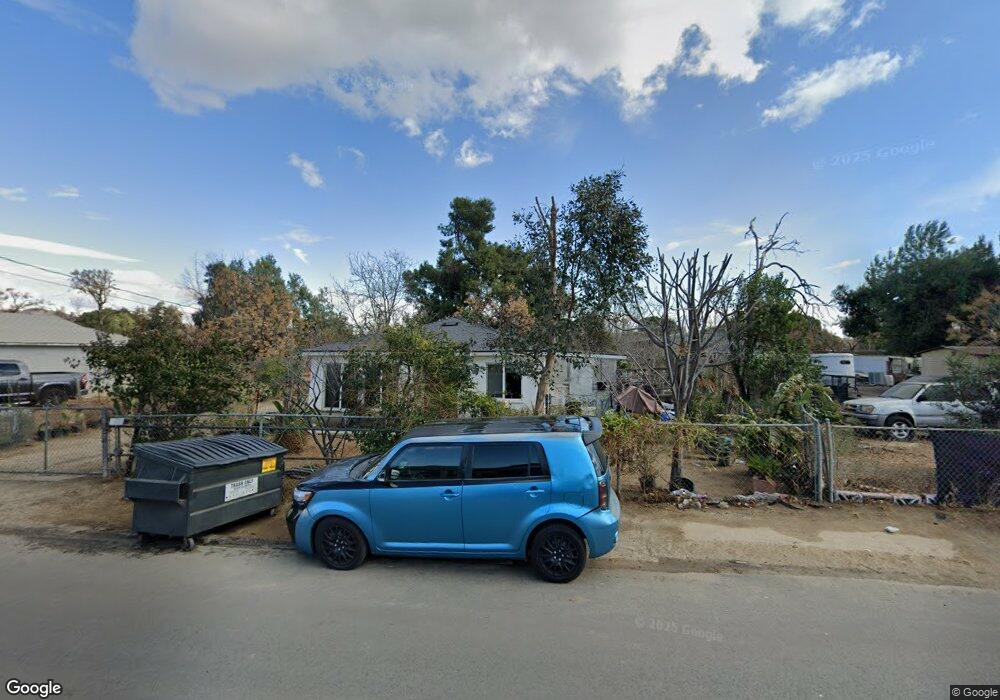
5046 Dodd St Mira Loma, CA 91752
Estimated Value: $505,000 - $572,650
3
Beds
1
Bath
858
Sq Ft
$631/Sq Ft
Est. Value
About This Home
This home is located at 5046 Dodd St, Mira Loma, CA 91752 and is currently estimated at $541,413, approximately $631 per square foot. 5046 Dodd St is a home located in Riverside County with nearby schools including Troth Street Elementary School, Mira Loma Middle School, and Jurupa Valley High School.
Ownership History
Date
Name
Owned For
Owner Type
Purchase Details
Closed on
Jan 29, 2003
Sold by
Ross Marie Diane and Morales Celia Vega
Bought by
Jimenez Luis Aldaco and Aldaco Alejandra B
Current Estimated Value
Home Financials for this Owner
Home Financials are based on the most recent Mortgage that was taken out on this home.
Original Mortgage
$148,500
Outstanding Balance
$63,135
Interest Rate
5.85%
Estimated Equity
$478,278
Purchase Details
Closed on
Sep 22, 2002
Sold by
Vega Frank C
Bought by
Ross Marie Diane and Morales Celia Vega
Purchase Details
Closed on
Nov 14, 1995
Sold by
Vega Frank C and Vega Otilia Q
Bought by
Vega Frank C
Create a Home Valuation Report for This Property
The Home Valuation Report is an in-depth analysis detailing your home's value as well as a comparison with similar homes in the area
Home Values in the Area
Average Home Value in this Area
Purchase History
| Date | Buyer | Sale Price | Title Company |
|---|---|---|---|
| Jimenez Luis Aldaco | $165,500 | Stewart Title Of Ca Inc | |
| Ross Marie Diane | -- | -- | |
| Vega Frank C | -- | -- |
Source: Public Records
Mortgage History
| Date | Status | Borrower | Loan Amount |
|---|---|---|---|
| Open | Jimenez Luis Aldaco | $148,500 |
Source: Public Records
Tax History Compared to Growth
Tax History
| Year | Tax Paid | Tax Assessment Tax Assessment Total Assessment is a certain percentage of the fair market value that is determined by local assessors to be the total taxable value of land and additions on the property. | Land | Improvement |
|---|---|---|---|---|
| 2025 | $2,565 | $239,522 | $72,397 | $167,125 |
| 2023 | $2,565 | $230,224 | $69,587 | $160,637 |
| 2022 | $2,522 | $225,711 | $68,223 | $157,488 |
| 2021 | $2,504 | $221,286 | $66,886 | $154,400 |
| 2020 | $2,482 | $219,018 | $66,201 | $152,817 |
| 2019 | $2,433 | $214,724 | $64,903 | $149,821 |
| 2018 | $2,355 | $210,515 | $63,632 | $146,883 |
| 2017 | $2,331 | $206,388 | $62,385 | $144,003 |
| 2016 | $2,300 | $202,342 | $61,162 | $141,180 |
| 2015 | $2,269 | $199,305 | $60,245 | $139,060 |
| 2014 | $2,114 | $195,403 | $59,066 | $136,337 |
Source: Public Records
Map
Nearby Homes