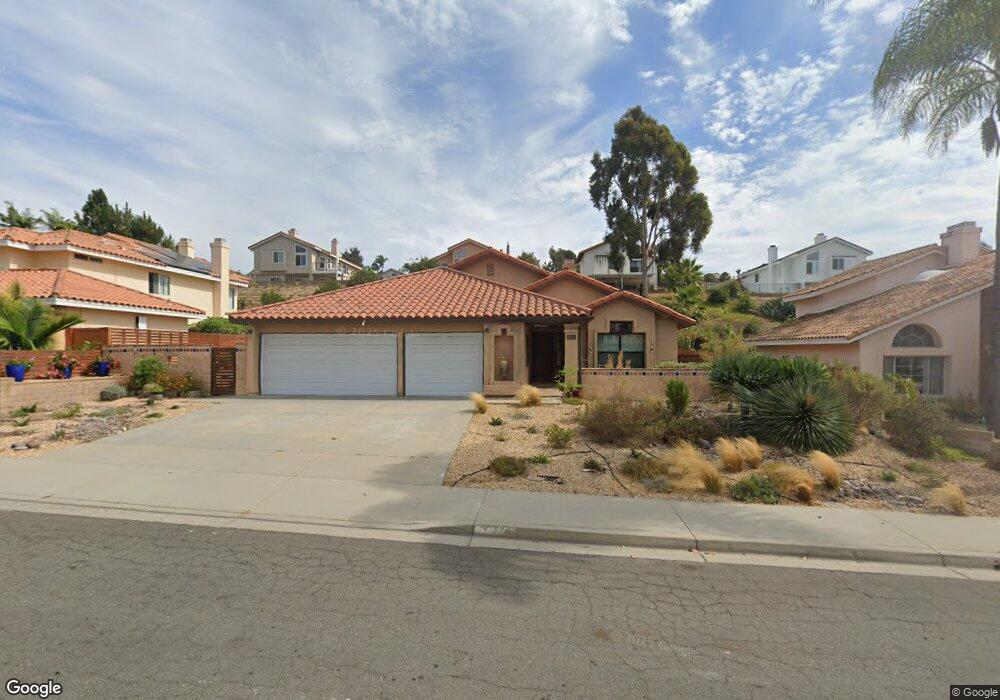
5047 Summerhill Dr Oceanside, CA 92057
Guajome NeighborhoodEstimated Value: $944,583 - $1,244,000
3
Beds
2
Baths
1,941
Sq Ft
$549/Sq Ft
Est. Value
About This Home
This home is located at 5047 Summerhill Dr, Oceanside, CA 92057 and is currently estimated at $1,064,646, approximately $548 per square foot. 5047 Summerhill Dr is a home located in San Diego County with nearby schools including Alamosa Park Elementary School, Roosevelt Middle School, and Vista High School.
Ownership History
Date
Name
Owned For
Owner Type
Purchase Details
Closed on
Aug 9, 2016
Sold by
Wiger George Raymond and Wiger Kerry Jeane
Bought by
Wiger George Raymond and Wiger Kerry Jeane
Current Estimated Value
Purchase Details
Closed on
Nov 18, 2008
Sold by
Wootan Wolford O and Wootan Juliana L
Bought by
Wiger George R and Wiger Kerry J
Home Financials for this Owner
Home Financials are based on the most recent Mortgage that was taken out on this home.
Original Mortgage
$280,000
Outstanding Balance
$183,435
Interest Rate
6.04%
Mortgage Type
Purchase Money Mortgage
Estimated Equity
$881,211
Purchase Details
Closed on
Sep 16, 1997
Sold by
Olson Fred J R and Olson Patricia C
Bought by
Wootan Wolford O and Wootan Juliana L
Home Financials for this Owner
Home Financials are based on the most recent Mortgage that was taken out on this home.
Original Mortgage
$148,000
Interest Rate
7.36%
Purchase Details
Closed on
Feb 13, 1989
Create a Home Valuation Report for This Property
The Home Valuation Report is an in-depth analysis detailing your home's value as well as a comparison with similar homes in the area
Home Values in the Area
Average Home Value in this Area
Purchase History
| Date | Buyer | Sale Price | Title Company |
|---|---|---|---|
| Wiger George Raymond | -- | None Available | |
| Wiger George R | $360,000 | Chicago Title Company | |
| Wootan Wolford O | $185,000 | Stewart Title | |
| -- | $161,000 | -- |
Source: Public Records
Mortgage History
| Date | Status | Borrower | Loan Amount |
|---|---|---|---|
| Open | Wiger George R | $280,000 | |
| Previous Owner | Wootan Wolford O | $148,000 |
Source: Public Records
Tax History
| Year | Tax Paid | Tax Assessment Tax Assessment Total Assessment is a certain percentage of the fair market value that is determined by local assessors to be the total taxable value of land and additions on the property. | Land | Improvement |
|---|---|---|---|---|
| 2025 | $5,049 | $463,574 | $180,277 | $283,297 |
| 2024 | $5,049 | $454,486 | $176,743 | $277,743 |
| 2023 | $4,928 | $445,576 | $173,278 | $272,298 |
| 2022 | $4,918 | $436,840 | $169,881 | $266,959 |
| 2021 | $4,809 | $428,275 | $166,550 | $261,725 |
| 2020 | $4,787 | $423,885 | $164,843 | $259,042 |
| 2019 | $4,712 | $415,574 | $161,611 | $253,963 |
| 2018 | $4,488 | $407,427 | $158,443 | $248,984 |
| 2017 | $4,414 | $399,439 | $155,337 | $244,102 |
| 2016 | $4,267 | $391,608 | $152,292 | $239,316 |
| 2015 | $4,251 | $385,727 | $150,005 | $235,722 |
| 2014 | $4,166 | $378,172 | $147,067 | $231,105 |
Source: Public Records
Map
Nearby Homes
- 1852 Red Willow Way
- 838 Masters Dr
- 4802 Baroque Terrace
- 1216 Woodview Dr
- 652 Montage Rd
- 997 Masters Dr
- 761 Masters Dr
- 4885 Baroque Terrace
- 872 Oro Grande St
- 5216 Palmera Dr
- 5005 Codorniz Way Unit 8
- 1560 Via Botero
- 5524 Giovanni Way
- 4791 Macadamia Ct
- 255 Flame Tree Place
- 1423 Mountain Meadow Dr
- 4733 Dalea Place
- 5259 Hubbert St
- 475 Taylor Dr
- 4740 Via Escala
- 5051 Summerhill Dr
- 5043 Summerhill Dr
- 5020 Frazee Rd
- 5012 Frazee Rd
- 5055 Summerhill Dr
- 5039 Summerhill Dr
- 5028 Frazee Rd
- 5004 Frazee Rd
- 5046 Summerhill Dr
- 5052 Summerhill Dr
- 5040 Summerhill Dr
- 5034 Frazee Rd
- 5058 Summerhill Dr
- 5059 Summerhill Dr
- 5035 Summerhill Dr
- 4996 Frazee Rd
- 5034 Summerhill Dr
- 5064 Summerhill Dr
- 5042 Frazee Rd
- 782 Lockwood Place
Your Personal Tour Guide
Ask me questions while you tour the home.