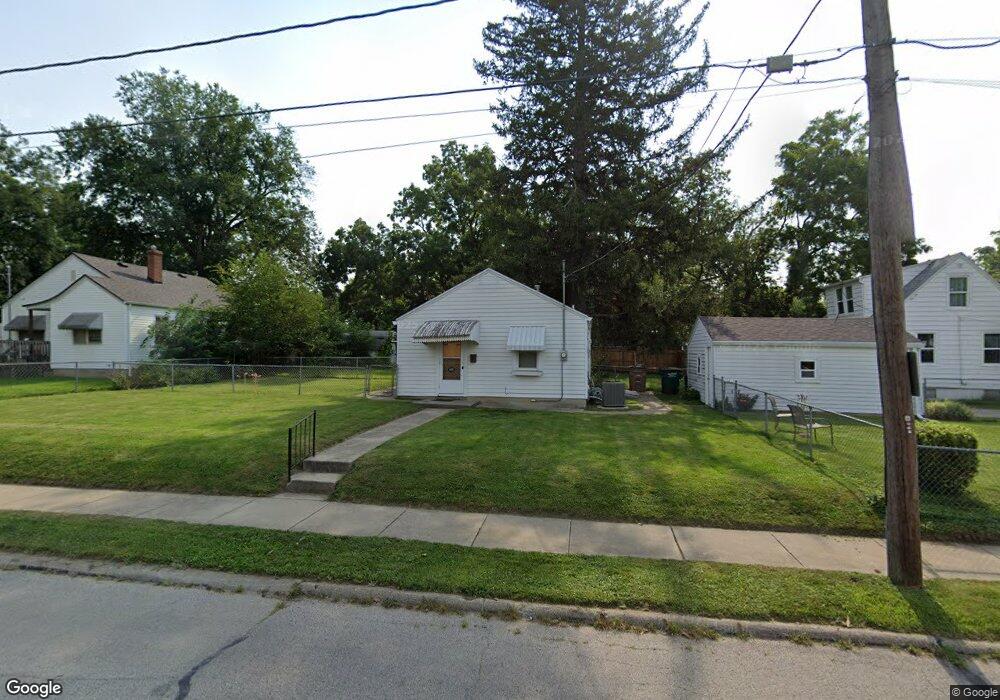
505 13th St West Des Moines, IA 50265
Estimated Value: $102,000 - $186,000
1
Bed
1
Bath
400
Sq Ft
$367/Sq Ft
Est. Value
About This Home
This home is located at 505 13th St, West Des Moines, IA 50265 and is currently estimated at $146,668, approximately $366 per square foot. 505 13th St is a home located in Polk County with nearby schools including Hillside Elementary School, Stilwell Junior High School, and Valley Southwoods Freshman High School.
Ownership History
Date
Name
Owned For
Owner Type
Purchase Details
Closed on
Sep 17, 2003
Sold by
Beaverbrooke Development Co
Bought by
Walters Martin E and Walters Kathleen E
Current Estimated Value
Home Financials for this Owner
Home Financials are based on the most recent Mortgage that was taken out on this home.
Original Mortgage
$162,000
Outstanding Balance
$76,441
Interest Rate
6.49%
Mortgage Type
Construction
Estimated Equity
$70,227
Purchase Details
Closed on
Oct 18, 2002
Sold by
Shapard Ramona
Bought by
Lillie Mike
Create a Home Valuation Report for This Property
The Home Valuation Report is an in-depth analysis detailing your home's value as well as a comparison with similar homes in the area
Home Values in the Area
Average Home Value in this Area
Purchase History
| Date | Buyer | Sale Price | Title Company |
|---|---|---|---|
| Walters Martin E | $34,500 | -- | |
| Lillie Mike | $62,500 | -- |
Source: Public Records
Mortgage History
| Date | Status | Borrower | Loan Amount |
|---|---|---|---|
| Open | Walters Martin E | $162,000 |
Source: Public Records
Tax History Compared to Growth
Tax History
| Year | Tax Paid | Tax Assessment Tax Assessment Total Assessment is a certain percentage of the fair market value that is determined by local assessors to be the total taxable value of land and additions on the property. | Land | Improvement |
|---|---|---|---|---|
| 2025 | $1,488 | $114,100 | $62,900 | $51,200 |
| 2024 | $1,488 | $104,400 | $57,300 | $47,100 |
| 2023 | $1,544 | $104,400 | $57,300 | $47,100 |
| 2022 | $1,524 | $88,800 | $49,400 | $39,400 |
| 2021 | $1,454 | $88,800 | $49,400 | $39,400 |
| 2020 | $1,428 | $81,100 | $44,900 | $36,200 |
| 2019 | $1,302 | $81,100 | $44,900 | $36,200 |
| 2018 | $1,302 | $72,100 | $39,400 | $32,700 |
| 2017 | $1,226 | $72,100 | $39,400 | $32,700 |
| 2016 | $1,194 | $66,500 | $36,200 | $30,300 |
| 2015 | $1,194 | $66,500 | $36,200 | $30,300 |
| 2014 | $1,128 | $62,600 | $33,600 | $29,000 |
Source: Public Records
Map
Nearby Homes