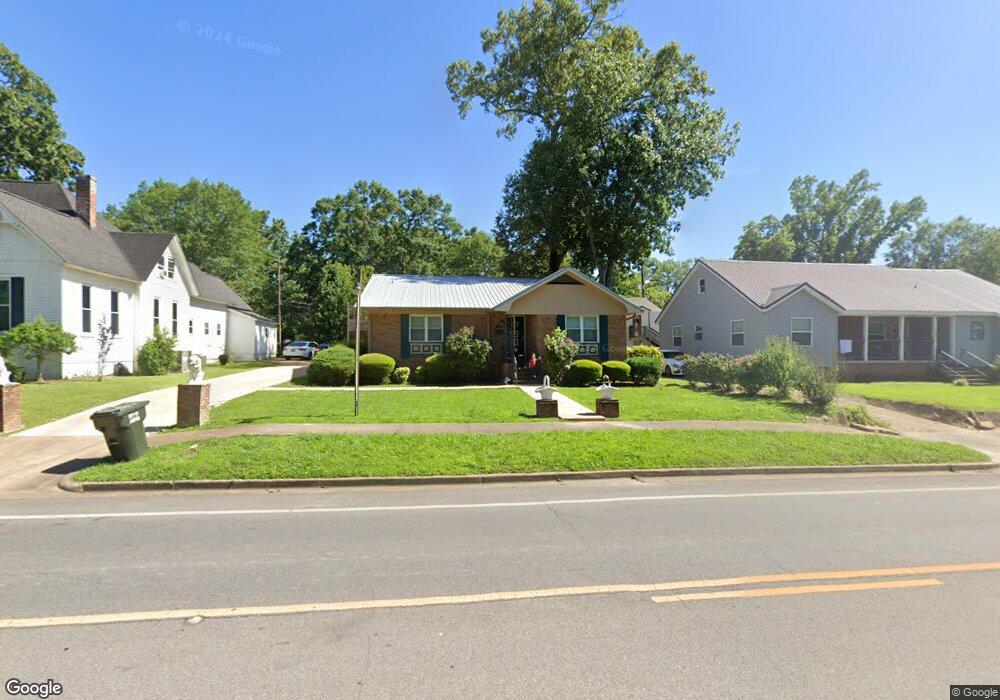
505 19th St E Jasper, AL 35501
Estimated Value: $258,000 - $427,000
Studio
1
Bath
3,219
Sq Ft
$105/Sq Ft
Est. Value
About This Home
This home is located at 505 19th St E, Jasper, AL 35501 and is currently estimated at $337,993, approximately $104 per square foot. 505 19th St E is a home located in Walker County with nearby schools including T. R. Simmons Elementary School, Maddox Intermediate School, and Memorial Park Elementary School.
Ownership History
Date
Name
Owned For
Owner Type
Purchase Details
Closed on
Mar 31, 2017
Sold by
Blackwell Thelan D and Blackwell Amanda
Bought by
Johnson Vernell
Current Estimated Value
Home Financials for this Owner
Home Financials are based on the most recent Mortgage that was taken out on this home.
Original Mortgage
$217,979
Outstanding Balance
$182,180
Interest Rate
4.37%
Mortgage Type
FHA
Estimated Equity
$155,813
Purchase Details
Closed on
Oct 31, 2014
Sold by
Mike Pilling Builders Llc
Bought by
Blackwell Thelan D
Create a Home Valuation Report for This Property
The Home Valuation Report is an in-depth analysis detailing your home's value as well as a comparison with similar homes in the area
Home Values in the Area
Average Home Value in this Area
Purchase History
| Date | Buyer | Sale Price | Title Company |
|---|---|---|---|
| Johnson Vernell | $222,000 | -- | |
| Blackwell Thelan D | $210,000 | -- |
Source: Public Records
Mortgage History
| Date | Status | Borrower | Loan Amount |
|---|---|---|---|
| Open | Johnson Vernell | $217,979 |
Source: Public Records
Tax History
| Year | Tax Paid | Tax Assessment Tax Assessment Total Assessment is a certain percentage of the fair market value that is determined by local assessors to be the total taxable value of land and additions on the property. | Land | Improvement |
|---|---|---|---|---|
| 2024 | $1,014 | $26,420 | $750 | $25,670 |
| 2023 | $1,014 | $23,460 | $750 | $22,710 |
| 2022 | $810 | $21,350 | $750 | $20,600 |
| 2021 | $790 | $19,562 | $750 | $18,812 |
| 2020 | $739 | $19,580 | $760 | $18,820 |
| 2019 | $703 | $18,680 | $760 | $17,920 |
| 2018 | $680 | $18,100 | $760 | $17,340 |
| 2017 | $678 | $18,040 | $760 | $17,280 |
| 2016 | $678 | $18,040 | $760 | $17,280 |
| 2015 | $865 | $21,620 | $1,500 | $20,120 |
| 2014 | $771 | $19,280 | $1,500 | $17,780 |
| 2013 | $765 | $19,120 | $1,500 | $17,620 |
Source: Public Records
Map
Nearby Homes
- 501 20th St E
- 414 21st St E
- 2009 Florida Ave
- 605 20th St E
- 2100 Euclid Ave
- 605 18th St E
- 2205 Euclid Ave
- 2100 Indiana Ave
- 1506 Gamble Ave
- 1512 Alabama Ave
- 0 3rd Ave
- 2210 3rd Ave
- 1824 3rd Ave
- 1207 Alabama Ave
- 1209 Alabama Ave
- 1021 Longbrook Dr
- 1200 Valley Rd
- 0 College Hill Rd
- 1700 6th Ave S
- 1304 5th Ave S
Your Personal Tour Guide
Ask me questions while you tour the home.