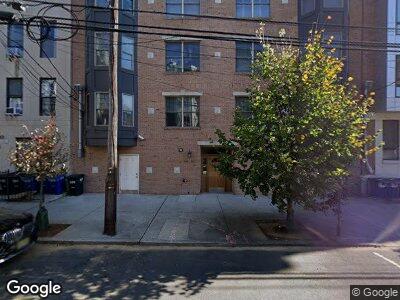
505-507 Monroe St Unit 3B Hoboken, NJ 07030
Estimated Value: $946,838 - $1,166,000
--
Bed
--
Bath
1,423
Sq Ft
$720/Sq Ft
Est. Value
About This Home
This home is located at 505-507 Monroe St Unit 3B, Hoboken, NJ 07030 and is currently estimated at $1,024,960, approximately $720 per square foot. 505-507 Monroe St Unit 3B is a home located in Hudson County with nearby schools including Hoboken High School, Hoboken Dual Language Charter School, and Hoboken Catholic Academy.
Ownership History
Date
Name
Owned For
Owner Type
Purchase Details
Closed on
Mar 28, 2006
Sold by
Franco Bradley C and Franco Gwen W
Bought by
Moyna Aiessa M
Current Estimated Value
Home Financials for this Owner
Home Financials are based on the most recent Mortgage that was taken out on this home.
Original Mortgage
$315,000
Interest Rate
6.28%
Mortgage Type
Purchase Money Mortgage
Purchase Details
Closed on
Jun 26, 2002
Sold by
Midtown Hoboken Llc
Bought by
Franco Bradley and Franco Gwen
Home Financials for this Owner
Home Financials are based on the most recent Mortgage that was taken out on this home.
Original Mortgage
$279,920
Interest Rate
6.64%
Mortgage Type
Balloon
Purchase Details
Closed on
Apr 7, 2000
Sold by
Mogh Habi
Bought by
Njs Enterprises Inc
Create a Home Valuation Report for This Property
The Home Valuation Report is an in-depth analysis detailing your home's value as well as a comparison with similar homes in the area
Home Values in the Area
Average Home Value in this Area
Purchase History
| Date | Buyer | Sale Price | Title Company |
|---|---|---|---|
| Moyna Aiessa M | $525,000 | Multiple | |
| Franco Bradley | $349,900 | -- | |
| Njs Enterprises Inc | $400,000 | -- |
Source: Public Records
Mortgage History
| Date | Status | Borrower | Loan Amount |
|---|---|---|---|
| Open | Moyna Aiessa M | $320,000 | |
| Closed | Moyna Aiessa M | $280,177 | |
| Closed | Moyna Aiessa M | $315,000 | |
| Previous Owner | Franco Bradley | $279,920 | |
| Previous Owner | Midtown Hoboken Llc | $1,100,000 |
Source: Public Records
Tax History Compared to Growth
Tax History
| Year | Tax Paid | Tax Assessment Tax Assessment Total Assessment is a certain percentage of the fair market value that is determined by local assessors to be the total taxable value of land and additions on the property. | Land | Improvement |
|---|---|---|---|---|
| 2024 | $9,044 | $555,200 | $175,000 | $380,200 |
| 2023 | $9,044 | $555,200 | $175,000 | $380,200 |
| 2022 | $8,889 | $555,200 | $175,000 | $380,200 |
| 2021 | $8,883 | $555,200 | $175,000 | $380,200 |
| 2020 | $8,944 | $555,200 | $175,000 | $380,200 |
| 2019 | $8,878 | $555,200 | $175,000 | $380,200 |
| 2018 | $8,772 | $555,200 | $175,000 | $380,200 |
| 2017 | $8,839 | $555,200 | $175,000 | $380,200 |
| 2016 | $8,611 | $555,200 | $175,000 | $380,200 |
| 2015 | $8,311 | $555,200 | $175,000 | $380,200 |
| 2014 | $7,928 | $555,200 | $175,000 | $380,200 |
Source: Public Records
Map
Nearby Homes
- 502 Monroe St Unit 401
- 502 Monroe St Unit 201
- 418 Monroe St Unit 501
- 413 Monroe St Unit 500
- 413 Monroe St Unit 200
- 414 Madison St Unit 3F
- 511 Madison St Unit 401
- 511 Madison St Unit 302
- 403 Monroe St Unit 3L
- 530 Madison St Unit 3B
- 333 Monroe St Unit 3B
- 531 Madison St Unit 2
- 410 Jefferson St Unit 1L
- 635 6th St Unit 4A
- 423 Jefferson St Unit 8
- 608 Madison St Unit 2
- 323 Jackson St Unit 602
- 610 Madison St Unit 3
- 318 Madison St Unit 5
- 405 Jefferson St Unit 2
- 505-507 Monroe St Unit 1B
- 505-507 Monroe St Unit 3B
- 505-507 Monroe St Unit 4A
- 505-507 Monroe St Unit 3A
- 505-507 Monroe St Unit 2B
- 505-507 Monroe St Unit 2A
- 505-507 Monroe St
- 505-507 Monroe St Unit 4B
- 503 Monroe St Unit 2
- 503 Monroe St Unit 3
- 503 Monroe St Unit 1
- 503 Monroe St Unit 4
- 501 Monroe St Unit 2
- 501 Monroe St
- 501 Monroe St
- 501 Monroe St Unit 4
- 501 Monroe St Unit 1
- 505 Monroe St
- 505 Monroe St Unit 4B
- 505 Monroe St Unit 2B