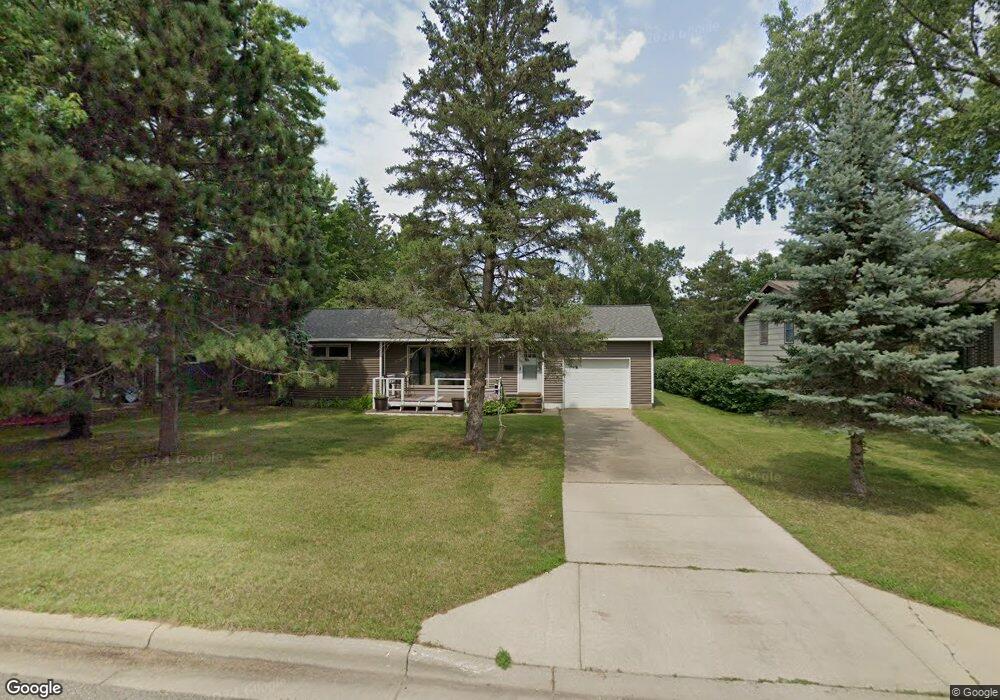
505 7th St W Park Rapids, MN 56470
Estimated Value: $186,000 - $209,000
2
Beds
3
Baths
1,115
Sq Ft
$176/Sq Ft
Est. Value
About This Home
This home is located at 505 7th St W, Park Rapids, MN 56470 and is currently estimated at $195,702, approximately $175 per square foot. 505 7th St W is a home located in Hubbard County with nearby schools including Century Elementary School, Century School, and Park Rapids Area High School.
Ownership History
Date
Name
Owned For
Owner Type
Purchase Details
Closed on
May 4, 2018
Sold by
Gartner Nicholas J
Bought by
Parks Carrie M
Current Estimated Value
Home Financials for this Owner
Home Financials are based on the most recent Mortgage that was taken out on this home.
Original Mortgage
$80,750
Outstanding Balance
$69,528
Interest Rate
4.4%
Mortgage Type
Purchase Money Mortgage
Estimated Equity
$126,174
Purchase Details
Closed on
Oct 6, 2016
Sold by
Whitchurch Marilyn Marilyn
Bought by
Gartner Nicholas Nicholas
Home Financials for this Owner
Home Financials are based on the most recent Mortgage that was taken out on this home.
Original Mortgage
$65,000
Interest Rate
3.42%
Purchase Details
Closed on
Oct 4, 2012
Sold by
Whitchurch Marilyn H and Kopperud Joan Louise
Bought by
Gartner Nicholas J
Home Financials for this Owner
Home Financials are based on the most recent Mortgage that was taken out on this home.
Original Mortgage
$59,500
Interest Rate
3.66%
Mortgage Type
Seller Take Back
Create a Home Valuation Report for This Property
The Home Valuation Report is an in-depth analysis detailing your home's value as well as a comparison with similar homes in the area
Home Values in the Area
Average Home Value in this Area
Purchase History
| Date | Buyer | Sale Price | Title Company |
|---|---|---|---|
| Parks Carrie M | $85,000 | -- | |
| Gartner Nicholas Nicholas | $65,000 | -- | |
| Gartner Nicholas J | $65,000 | None Available |
Source: Public Records
Mortgage History
| Date | Status | Borrower | Loan Amount |
|---|---|---|---|
| Open | Parks Carrie M | $80,750 | |
| Previous Owner | Gartner Nicholas Nicholas | $65,000 | |
| Previous Owner | Gartner Nicholas J | $59,500 |
Source: Public Records
Tax History Compared to Growth
Tax History
| Year | Tax Paid | Tax Assessment Tax Assessment Total Assessment is a certain percentage of the fair market value that is determined by local assessors to be the total taxable value of land and additions on the property. | Land | Improvement |
|---|---|---|---|---|
| 2024 | $2,348 | $199,700 | $16,600 | $183,100 |
| 2023 | $1,802 | $150,800 | $16,600 | $134,200 |
| 2022 | $1,474 | $150,800 | $16,600 | $134,200 |
| 2021 | $1,464 | $116,700 | $14,800 | $101,900 |
| 2020 | $1,298 | $90,000 | $12,648 | $77,352 |
| 2019 | $1,144 | $75,500 | $11,975 | $63,525 |
| 2018 | $2,358 | $90,300 | $14,300 | $76,000 |
| 2016 | $2,458 | $85,700 | $14,300 | $71,400 |
| 2015 | $946 | $63,700 | $10,594 | $53,106 |
| 2014 | $942 | $63,100 | $12,332 | $50,768 |
Source: Public Records
Map
Nearby Homes
- 603 7th St W
- 900 Pleasant Ave S
- 1008 Sunrise Cir
- TBD 2nd St W
- 619 2nd St W
- 31282 U S Highway 71
- 812 8th St W
- 700 Washington Ave S
- 201 Riverside Ave
- 304 Lake Ave
- 503 Lake Ave
- 300 Central Ave S
- 202 Central Ave S
- 707 Bridge St
- 716 Park Ave N Unit 3
- 15581 Deerwood Loop
- 1119 Timbers Dr
- 1002 Park Ave N
- ABC Henrietta Ave
- 806 Central Ave N