Estimated Value: $1,919,000 - $2,493,000
3
Beds
4
Baths
2,406
Sq Ft
$888/Sq Ft
Est. Value
About This Home
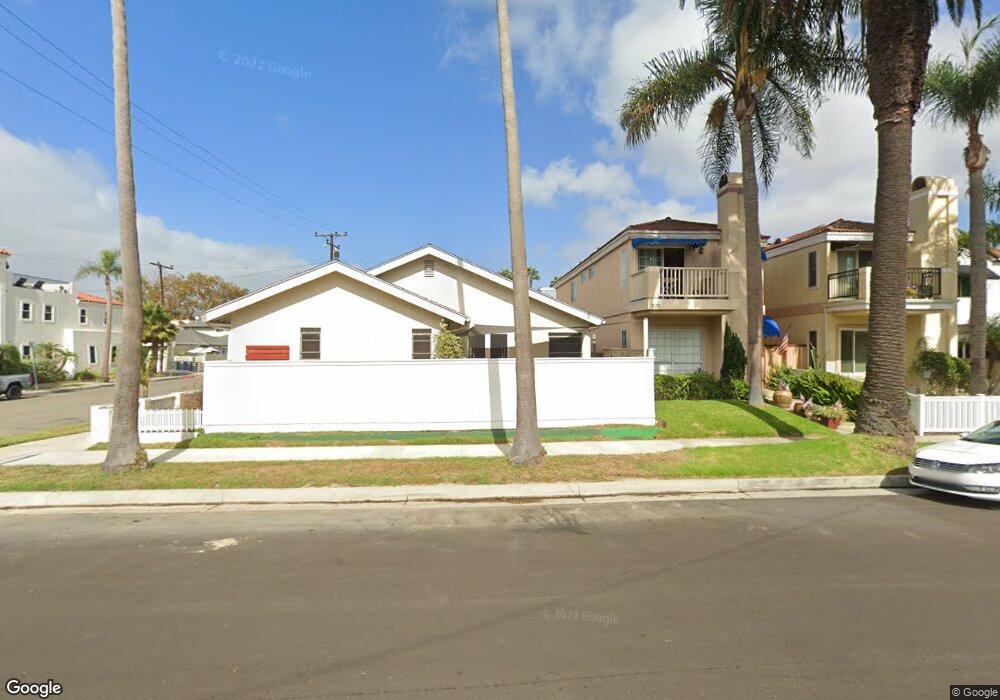
This home is located at 505 9th St, Huntington Beach, CA 92648 and is currently estimated at $2,137,058, approximately $888 per square foot. 505 9th St is a home located in Orange County with nearby schools including Agnes L. Smith Elementary, Ethel Dwyer Middle, and Huntington Beach High School.
Ownership History
Date
Name
Owned For
Owner Type
Purchase Details
Closed on
Nov 7, 2024
Sold by
Carlson Lyle D
Bought by
Lyle Carlson Revocable Living Trust and Carlson
Current Estimated Value
Purchase Details
Closed on
Aug 1, 2018
Sold by
Carlson Lyle D and Carlson Susan M
Bought by
Carlson Lyle D
Purchase Details
Closed on
May 3, 1995
Sold by
Ge Capital Asset Management Corp
Bought by
Carlson Lyle D and Carlson Susan M
Home Financials for this Owner
Home Financials are based on the most recent Mortgage that was taken out on this home.
Original Mortgage
$239,200
Interest Rate
8.36%
Purchase Details
Closed on
Mar 15, 1995
Sold by
Texas Commerce Bank National Assn
Bought by
Ge Capital Asset Management Corp
Home Financials for this Owner
Home Financials are based on the most recent Mortgage that was taken out on this home.
Original Mortgage
$239,200
Interest Rate
8.36%
Purchase Details
Closed on
Dec 28, 1993
Sold by
Professional Foreclosure Corp
Bought by
Texas Commerce Bank National Assn
Purchase Details
Closed on
Nov 18, 1993
Sold by
Tyler James R
Bought by
Tyler Rosan M
Create a Home Valuation Report for This Property
The Home Valuation Report is an in-depth analysis detailing your home's value as well as a comparison with similar homes in the area
Home Values in the Area
Average Home Value in this Area
Purchase History
| Date | Buyer | Sale Price | Title Company |
|---|---|---|---|
| Lyle Carlson Revocable Living Trust | -- | None Listed On Document | |
| Lyle Carlson Revocable Living Trust | -- | None Listed On Document | |
| Carlson Lyle D | -- | None Available | |
| Carlson Lyle D | $299,000 | Stewart Title | |
| Ge Capital Asset Management Corp | -- | Stewart Title | |
| Texas Commerce Bank National Assn | $339,000 | Chicago Title Company | |
| Tyler Rosan M | -- | -- |
Source: Public Records
Mortgage History
| Date | Status | Borrower | Loan Amount |
|---|---|---|---|
| Previous Owner | Carlson Lyle D | $239,200 |
Source: Public Records
Tax History Compared to Growth
Tax History
| Year | Tax Paid | Tax Assessment Tax Assessment Total Assessment is a certain percentage of the fair market value that is determined by local assessors to be the total taxable value of land and additions on the property. | Land | Improvement |
|---|---|---|---|---|
| 2025 | $5,821 | $502,224 | $230,277 | $271,947 |
| 2024 | $5,821 | $492,377 | $225,762 | $266,615 |
| 2023 | $5,689 | $482,723 | $221,335 | $261,388 |
| 2022 | $5,540 | $473,258 | $216,995 | $256,263 |
| 2021 | $5,438 | $463,979 | $212,740 | $251,239 |
| 2020 | $5,402 | $459,222 | $210,559 | $248,663 |
| 2019 | $5,340 | $450,218 | $206,430 | $243,788 |
| 2018 | $5,258 | $441,391 | $202,383 | $239,008 |
| 2017 | $5,189 | $432,737 | $198,415 | $234,322 |
| 2016 | $4,962 | $424,252 | $194,524 | $229,728 |
| 2015 | $4,914 | $417,880 | $191,602 | $226,278 |
| 2014 | $4,812 | $409,695 | $187,849 | $221,846 |
Source: Public Records
Map
Nearby Homes
- 427 10th St
- 621 8th St
- 526 12th St
- 309 8th St
- 513 Pecan Ave
- 521 12th St
- 221 10th St
- 1111 Olive Ave Unit A & B
- 228 12th St Unit 1113 Olive Av
- 316 6th St
- 613 13th St
- 116 11th St
- 413 14th St Unit D
- 1102 Pacific Coast Hwy Unit Lot 4
- 319 14th St Unit B
- 945 10th St
- 308 5th St
- 416 15th St
- 949 10th St
- 414 Main St Unit 400