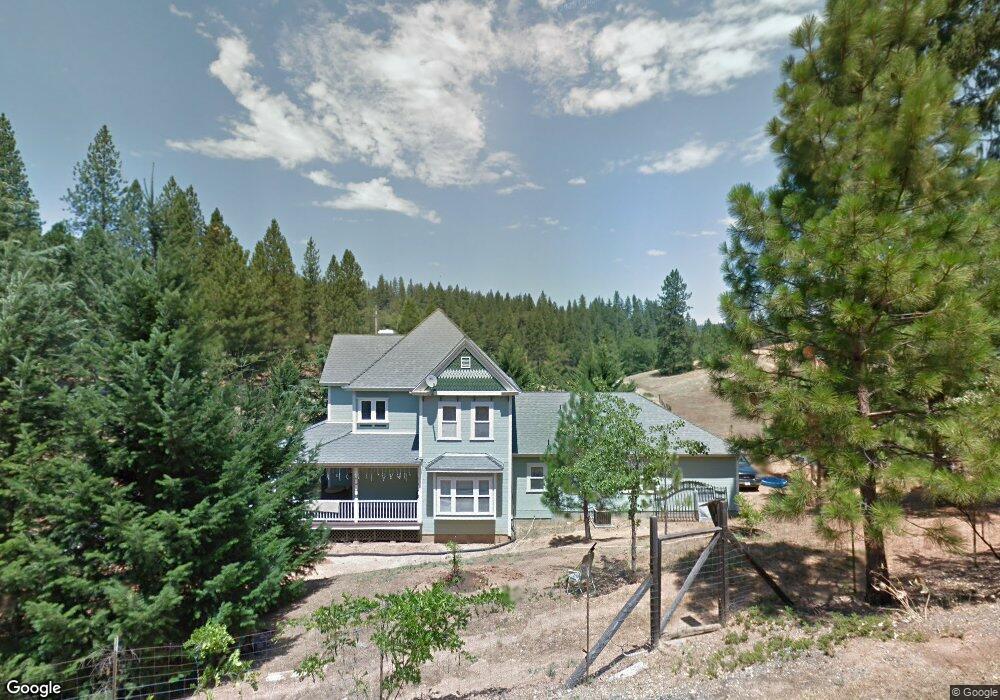
505 Caruso Ct Colfax, CA 95713
Estimated Value: $514,000 - $695,000
4
Beds
2
Baths
2,092
Sq Ft
$294/Sq Ft
Est. Value
About This Home
This home is located at 505 Caruso Ct, Colfax, CA 95713 and is currently estimated at $614,177, approximately $293 per square foot. 505 Caruso Ct is a home located in Placer County with nearby schools including Colfax Elementary School and Colfax High School.
Ownership History
Date
Name
Owned For
Owner Type
Purchase Details
Closed on
Jun 28, 2017
Sold by
Paulus Christopher W and Paulus Shirley M
Bought by
Paulus Christopher and Paulus Shirley
Current Estimated Value
Purchase Details
Closed on
Mar 26, 2008
Sold by
Smith Mary A and Finigan Thomas W
Bought by
Paulus Christopher W and Paulus Shirley M
Home Financials for this Owner
Home Financials are based on the most recent Mortgage that was taken out on this home.
Original Mortgage
$364,000
Outstanding Balance
$227,555
Interest Rate
5.72%
Mortgage Type
Purchase Money Mortgage
Estimated Equity
$386,622
Purchase Details
Closed on
Nov 14, 2005
Sold by
Mcclure Thomas H
Bought by
Smith Mary A and Finigan Thomas W
Home Financials for this Owner
Home Financials are based on the most recent Mortgage that was taken out on this home.
Original Mortgage
$128,400
Interest Rate
5.97%
Mortgage Type
Stand Alone Second
Purchase Details
Closed on
Oct 28, 2002
Sold by
Mcclure Thomas H
Bought by
Mcclure Thomas H
Create a Home Valuation Report for This Property
The Home Valuation Report is an in-depth analysis detailing your home's value as well as a comparison with similar homes in the area
Home Values in the Area
Average Home Value in this Area
Purchase History
| Date | Buyer | Sale Price | Title Company |
|---|---|---|---|
| Paulus Christopher | -- | None Available | |
| Paulus Christopher W | $455,000 | Placer Title Company | |
| Smith Mary A | $642,000 | Chicago Title | |
| Mcclure Thomas H | -- | -- |
Source: Public Records
Mortgage History
| Date | Status | Borrower | Loan Amount |
|---|---|---|---|
| Open | Paulus Christopher W | $364,000 | |
| Previous Owner | Smith Mary A | $128,400 | |
| Previous Owner | Smith Mary A | $513,600 |
Source: Public Records
Tax History Compared to Growth
Tax History
| Year | Tax Paid | Tax Assessment Tax Assessment Total Assessment is a certain percentage of the fair market value that is determined by local assessors to be the total taxable value of land and additions on the property. | Land | Improvement |
|---|---|---|---|---|
| 2025 | $6,029 | $597,633 | $177,316 | $420,317 |
| 2023 | $6,029 | $574,429 | $170,432 | $403,997 |
| 2022 | $5,833 | $563,167 | $167,091 | $396,076 |
| 2021 | $5,707 | $552,125 | $163,815 | $388,310 |
| 2020 | $5,641 | $546,465 | $162,136 | $384,329 |
| 2019 | $5,529 | $535,751 | $158,957 | $376,794 |
| 2018 | $5,334 | $525,247 | $155,841 | $369,406 |
| 2017 | $5,238 | $514,949 | $152,786 | $362,163 |
| 2016 | $5,126 | $504,853 | $149,791 | $355,062 |
| 2015 | $5,001 | $497,270 | $147,541 | $349,729 |
| 2014 | $4,776 | $473,000 | $140,300 | $332,700 |
Source: Public Records
Map
Nearby Homes
- 416 Rubicon Ct
- 1124 Sierra Oaks Dr
- 508 Chase Ct
- 70 Iowa Hill Rd
- 212 Glendale Rd
- 24275 Grand View Ave
- 1836 Canyon Way
- 7-Acres Canyon Way
- 309 S Auburn St
- 155 Whitcomb Ave
- 1366 Oak Ridge Dr
- 24580 View Cape Horn Ave
- 34 Washington
- 38 Lincoln St
- 30 Lincoln St
- 147 Scholtz Ave
- 150 W Oak St
- 0 Kneeland St Unit 225109849
- 9 Rising Sun Rd
- 230 Rising Sun Rd
- 520 Caruso Ct
- 1 Grand View Way
- 0 Grand View Way
- 550 Caruso Ct
- 715 Caruso Ct
- 23829 Grand View Way
- 705 Caruso Ct
- 23755 Grand View Way
- 675 Caruso Ct
- 408 Rubicon Ct Unit Lot18
- 408 Rubicon Ct Unit Lot01
- 408 Rubicon Ct Unit Lot20
- 408 Rubicon Ct Unit Lot09
- 408 Rubicon Ct Unit Lot33
- 412 Rubicon Ct
- 404 Rubicon Ct Unit Lot19
- 510 Moonrise Ct
- 400 Rubicon Ct Unit Lot20