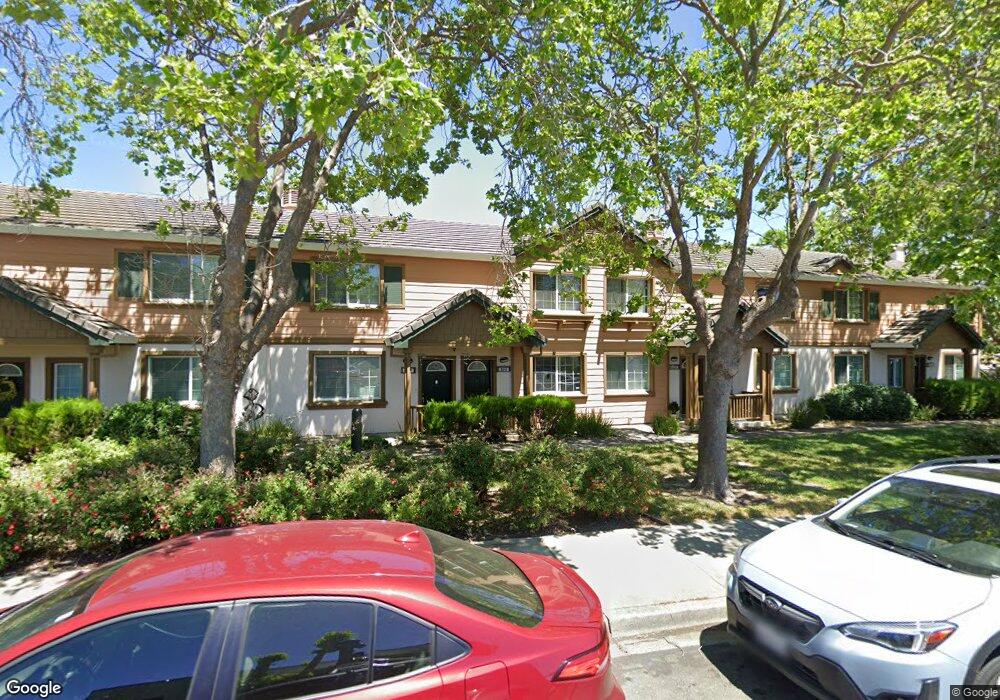
505 Daniels Ave Vallejo, CA 94590
Vallejo Heights NeighborhoodEstimated Value: $207,693 - $280,000
2
Beds
1
Bath
784
Sq Ft
$320/Sq Ft
Est. Value
About This Home
This home is located at 505 Daniels Ave, Vallejo, CA 94590 and is currently estimated at $251,173, approximately $320 per square foot. 505 Daniels Ave is a home located in Solano County with nearby schools including Federal Terrace Elementary School, Vallejo High School, and Caliber: ChangeMakers Academy.
Ownership History
Date
Name
Owned For
Owner Type
Purchase Details
Closed on
Feb 2, 2024
Sold by
Chan Yun Sang
Bought by
Chan Yun and Lin Yan
Current Estimated Value
Purchase Details
Closed on
Nov 22, 2010
Sold by
Derobles Elias C and Derobles Tara M
Bought by
Chan Yun Song
Purchase Details
Closed on
Jul 7, 2005
Sold by
Olonan Alvin and Olonan Lea
Bought by
Derobles Elias C and Ross Tara M
Home Financials for this Owner
Home Financials are based on the most recent Mortgage that was taken out on this home.
Original Mortgage
$57,000
Interest Rate
5.12%
Mortgage Type
Stand Alone Second
Purchase Details
Closed on
May 30, 2003
Sold by
Western Pacific Housing Inc
Bought by
Olonan Alvin and Olonan Lea
Home Financials for this Owner
Home Financials are based on the most recent Mortgage that was taken out on this home.
Original Mortgage
$144,278
Interest Rate
5.75%
Mortgage Type
Purchase Money Mortgage
Create a Home Valuation Report for This Property
The Home Valuation Report is an in-depth analysis detailing your home's value as well as a comparison with similar homes in the area
Home Values in the Area
Average Home Value in this Area
Purchase History
We collect this data history from publicly available records. To have your information removed, we recommend requesting removal directly through your county’s website.
| Date | Buyer | Sale Price | Title Company |
|---|---|---|---|
| Chan Yun | -- | None Listed On Document | |
| Chan Yun Song | $55,000 | Old Republic Title Company | |
| Derobles Elias C | $285,000 | Alliance Title Co | |
| Olonan Alvin | $180,500 | First American Title Co |
Source: Public Records
Mortgage History
We collect this data history from publicly available records. To have your information removed, we recommend requesting removal directly through your county’s website.
| Date | Status | Borrower | Loan Amount |
|---|---|---|---|
| Previous Owner | Derobles Elias C | $57,000 | |
| Previous Owner | Derobles Elias C | $228,000 | |
| Previous Owner | Olonan Alvin | $144,278 | |
| Closed | Olonan Alvin | $36,070 |
Source: Public Records
Tax History
| Year | Tax Paid | Tax Assessment Tax Assessment Total Assessment is a certain percentage of the fair market value that is determined by local assessors to be the total taxable value of land and additions on the property. | Land | Improvement |
|---|---|---|---|---|
| 2025 | $1,885 | $70,454 | $19,212 | $51,242 |
| 2024 | $1,885 | $69,074 | $18,837 | $50,237 |
| 2023 | $1,731 | $67,720 | $18,468 | $49,252 |
| 2022 | $1,607 | $66,393 | $18,106 | $48,287 |
| 2021 | $1,579 | $65,092 | $17,751 | $47,341 |
| 2020 | $1,559 | $64,425 | $17,569 | $46,856 |
| 2019 | $1,485 | $63,163 | $17,225 | $45,938 |
| 2018 | $1,372 | $61,926 | $16,888 | $45,038 |
| 2017 | $1,284 | $60,712 | $16,557 | $44,155 |
| 2016 | $713 | $59,523 | $16,233 | $43,290 |
| 2015 | $704 | $58,630 | $15,990 | $42,640 |
| 2014 | $694 | $57,482 | $15,677 | $41,805 |
Source: Public Records
Map
Nearby Homes
- 712 Daniels Ave
- 136 Calhoun St Unit 73
- 69 Baldwin St
- 2402 Sacramento St
- 2269 Sacramento St
- 493 Lighthouse Dr
- 3 Parrott St
- 405 Lighthouse Dr
- 403 Lighthouse Dr
- 297 Lighthouse Dr
- 225 Lighthouse Dr
- 237 Lighthouse Dr
- 12 Daniels Ave
- 199 Harrier Ave
- 732 Wilson Ave
- 110 Harrier Ave
- 112 Harrier Ave
- 1 Harrier Ave
- 178 Baxter St
- 25 Burnham St
- 503 Daniels Ave
- 507 Daniels Ave
- 509 Daniels Ave
- 501 Daniels Ave
- 523 Daniels Ave
- 511 Daniels Ave
- 521 Daniels Ave
- 525 Daniels Ave
- 519 Daniels Ave Unit 93
- 517 Daniels Ave
- 515 Daniels Ave
- 529 Daniels Ave Unit 98
- 607 Daniels Ave
- 609 Daniels Ave
- 516 Daniels Ave
- 611 Daniels Ave Unit 86
- 504 Daniels Ave
- 615 Daniels Ave
- 605 Daniels Ave
- 603 Daniels Ave
Your Personal Tour Guide
Ask me questions while you tour the home.