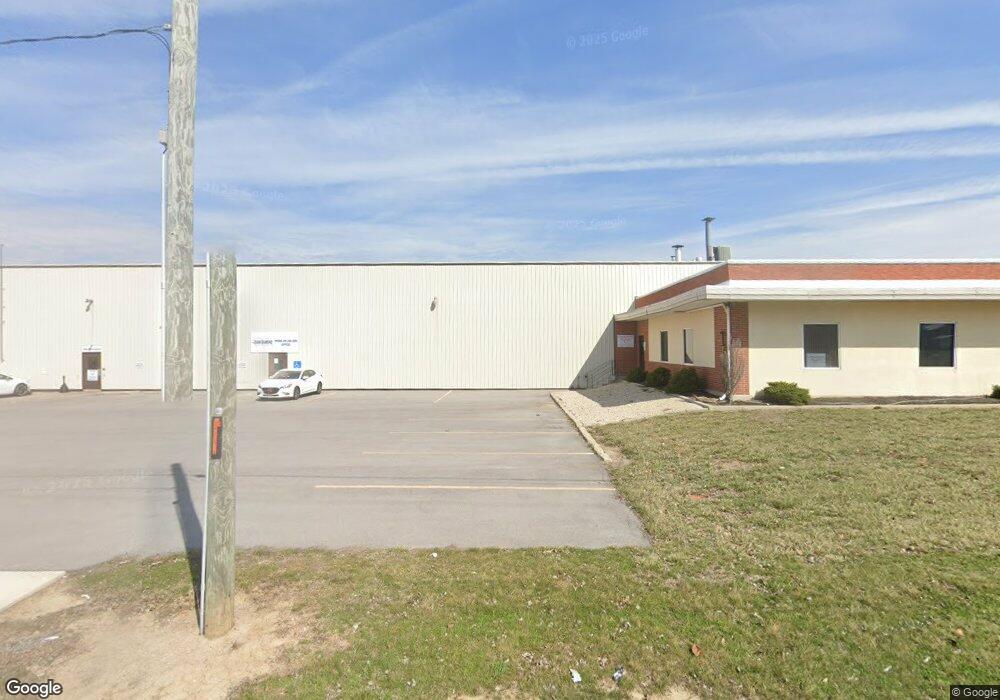
505 E Jefferson St Bluffton, OH 45817
--
Bed
3
Baths
4,800
Sq Ft
11.49
Acres
About This Home
This home is located at 505 E Jefferson St, Bluffton, OH 45817. 505 E Jefferson St is a home located in Allen County with nearby schools including Bluffton Elementary School, Bluffton Middle School, and Bluffton High School.
Ownership History
Date
Name
Owned For
Owner Type
Purchase Details
Closed on
Apr 10, 2008
Sold by
Mid Bus Inc
Bought by
Btms Investments Llc
Home Financials for this Owner
Home Financials are based on the most recent Mortgage that was taken out on this home.
Original Mortgage
$800,000
Outstanding Balance
$167,775
Interest Rate
6.32%
Mortgage Type
Commercial
Purchase Details
Closed on
Apr 22, 2005
Sold by
Bsw Inc
Bought by
Mid Bus Inc
Purchase Details
Closed on
Aug 31, 1994
Sold by
Textron Properties Inc
Bought by
Breidenbach & Swan Investment
Home Financials for this Owner
Home Financials are based on the most recent Mortgage that was taken out on this home.
Original Mortgage
$1,800,000
Interest Rate
8.59%
Mortgage Type
Commercial
Purchase Details
Closed on
Apr 14, 1987
Bought by
Excello Corporation
Create a Home Valuation Report for This Property
The Home Valuation Report is an in-depth analysis detailing your home's value as well as a comparison with similar homes in the area
Home Values in the Area
Average Home Value in this Area
Purchase History
| Date | Buyer | Sale Price | Title Company |
|---|---|---|---|
| Btms Investments Llc | $1,400,000 | Attorney | |
| Mid Bus Inc | $2,000,000 | None Available | |
| Breidenbach & Swan Investment | $1,200,000 | -- | |
| Excello Corporation | -- | -- |
Source: Public Records
Mortgage History
| Date | Status | Borrower | Loan Amount |
|---|---|---|---|
| Open | Btms Investments Llc | $800,000 | |
| Previous Owner | Breidenbach & Swan Investment | $1,800,000 |
Source: Public Records
Tax History Compared to Growth
Tax History
| Year | Tax Paid | Tax Assessment Tax Assessment Total Assessment is a certain percentage of the fair market value that is determined by local assessors to be the total taxable value of land and additions on the property. | Land | Improvement |
|---|---|---|---|---|
| 2024 | $47,515 | $1,263,300 | $141,580 | $1,121,720 |
| 2023 | $45,133 | $1,146,010 | $128,700 | $1,017,310 |
| 2022 | $42,019 | $1,146,010 | $128,700 | $1,017,310 |
| 2021 | $41,086 | $1,146,010 | $128,700 | $1,017,310 |
| 2020 | $42,078 | $1,075,870 | $100,560 | $975,310 |
| 2019 | $42,078 | $1,075,870 | $100,560 | $975,310 |
| 2018 | $42,197 | $1,075,870 | $100,560 | $975,310 |
| 2017 | $42,621 | $1,075,870 | $100,560 | $975,310 |
| 2016 | $38,576 | $863,280 | $100,560 | $762,720 |
| 2015 | $38,072 | $863,280 | $100,560 | $762,720 |
| 2014 | $38,072 | $859,330 | $100,560 | $758,770 |
| 2013 | $35,677 | $859,330 | $100,560 | $758,770 |
Source: Public Records
Map
Nearby Homes
- 164 S Mound St
- 0 State Route 103
- 108 Sally Ln
- 136 N Spring St
- 135 Grove St
- 217 Grove St
- 222 Grove St
- 168 Garmatter St
- 430 S Jackson St
- 513 S Jackson St
- 139 Richland Dr
- 301 Parkview Dr
- 303 Parkview Dr
- 109 Garmatter St
- 305 Parkview Dr
- 307 Parkview Dr
- 313 Parkview Dr
- 315 Parkview Dr
- 317 Parkview Dr
- 182 Sunset Dr