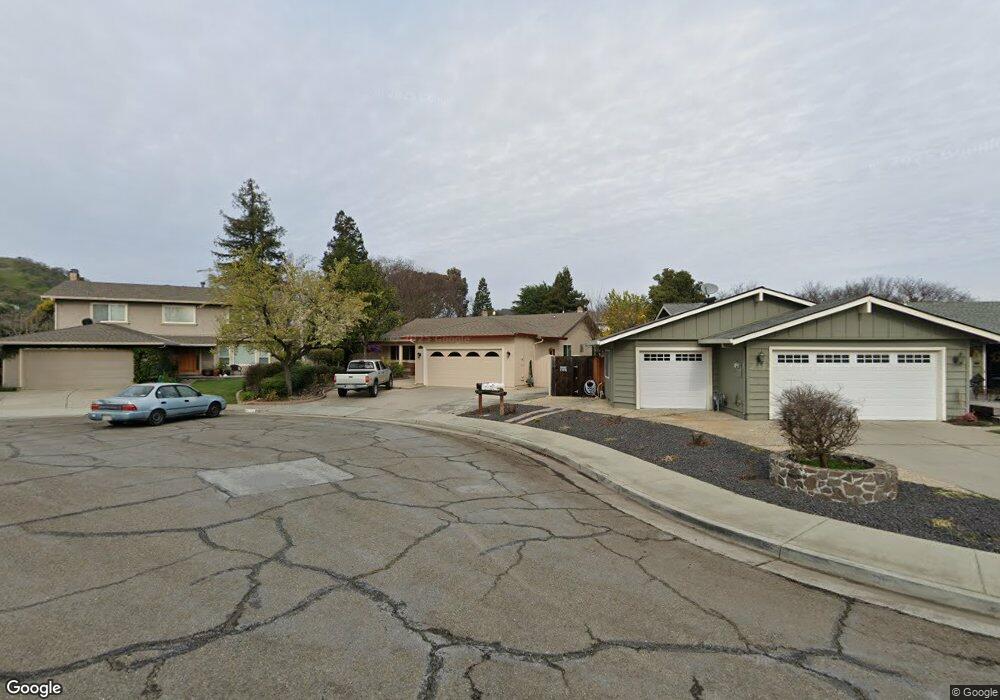
505 La Paz Ct Morgan Hill, CA 95037
Estimated Value: $1,275,000 - $1,314,000
4
Beds
2
Baths
1,874
Sq Ft
$696/Sq Ft
Est. Value
About This Home
This home is located at 505 La Paz Ct, Morgan Hill, CA 95037 and is currently estimated at $1,303,734, approximately $695 per square foot. 505 La Paz Ct is a home located in Santa Clara County with nearby schools including Paradise Valley Elementary, Britton Middle School, and Ann Sobrato High School.
Ownership History
Date
Name
Owned For
Owner Type
Purchase Details
Closed on
Aug 16, 2005
Sold by
Perez Ricardo E and Perez Sylvia R
Bought by
Perez Ricardo E and Perez Sylvia R
Current Estimated Value
Home Financials for this Owner
Home Financials are based on the most recent Mortgage that was taken out on this home.
Original Mortgage
$495,000
Outstanding Balance
$259,194
Interest Rate
5.61%
Mortgage Type
New Conventional
Estimated Equity
$1,044,540
Purchase Details
Closed on
Jul 15, 2003
Sold by
Barker Cindy E
Bought by
Perez Ricardo E and Perez Sylvia R
Home Financials for this Owner
Home Financials are based on the most recent Mortgage that was taken out on this home.
Original Mortgage
$414,400
Interest Rate
5.29%
Mortgage Type
Purchase Money Mortgage
Purchase Details
Closed on
Nov 24, 1999
Sold by
Loy Barker
Bought by
Barker Loy
Purchase Details
Closed on
Mar 31, 1998
Sold by
Pappas Nicholas P and Pappas Vicki I
Bought by
Barker Loy
Create a Home Valuation Report for This Property
The Home Valuation Report is an in-depth analysis detailing your home's value as well as a comparison with similar homes in the area
Home Values in the Area
Average Home Value in this Area
Purchase History
| Date | Buyer | Sale Price | Title Company |
|---|---|---|---|
| Perez Ricardo E | -- | Alliance Title Company | |
| Perez Ricardo E | $518,000 | Chicago Title | |
| Barker Loy | -- | -- | |
| Barker Loy | $330,000 | Commonwealth Land Title Co |
Source: Public Records
Mortgage History
| Date | Status | Borrower | Loan Amount |
|---|---|---|---|
| Open | Perez Ricardo E | $495,000 | |
| Closed | Perez Ricardo E | $414,400 | |
| Closed | Perez Ricardo E | $51,800 |
Source: Public Records
Tax History Compared to Growth
Tax History
| Year | Tax Paid | Tax Assessment Tax Assessment Total Assessment is a certain percentage of the fair market value that is determined by local assessors to be the total taxable value of land and additions on the property. | Land | Improvement |
|---|---|---|---|---|
| 2025 | $8,339 | $736,471 | $355,440 | $381,031 |
| 2024 | $8,339 | $722,031 | $348,471 | $373,560 |
| 2023 | $8,232 | $707,875 | $341,639 | $366,236 |
| 2022 | $8,094 | $693,996 | $334,941 | $359,055 |
| 2021 | $7,892 | $680,389 | $328,374 | $352,015 |
| 2020 | $7,702 | $673,413 | $325,007 | $348,406 |
| 2019 | $7,920 | $660,210 | $318,635 | $341,575 |
| 2018 | $7,944 | $647,266 | $312,388 | $334,878 |
| 2017 | $7,869 | $634,575 | $306,263 | $328,312 |
| 2016 | $7,370 | $622,133 | $300,258 | $321,875 |
| 2015 | $7,292 | $612,789 | $295,748 | $317,041 |
| 2014 | $7,394 | $600,786 | $289,955 | $310,831 |
Source: Public Records
Map
Nearby Homes
- 605 Encino Dr
- 542 Via Sorrento
- 15180 Venetian Way
- 15120 Venetian Way
- 15145 Bellini Way
- 140 La Crosse Dr
- 136 Vinewood Ln Unit 136
- 199 Leisure Dr Unit 199
- 97 Melody Ln Unit 97
- 92 Melody Ln Unit 92
- 56 Creekside Dr Unit 56
- 42 Dewey Cir
- 407 Scotts Bluff Place
- 1020 Brookview Ct
- 15223 Perry Ln
- 15209 Sycamore Dr
- 0 Seymour Ave Unit 225017465
- 14430 Monterey Hwy
- 225 Spring Ave Unit 5
- 14325 Monterey Rd