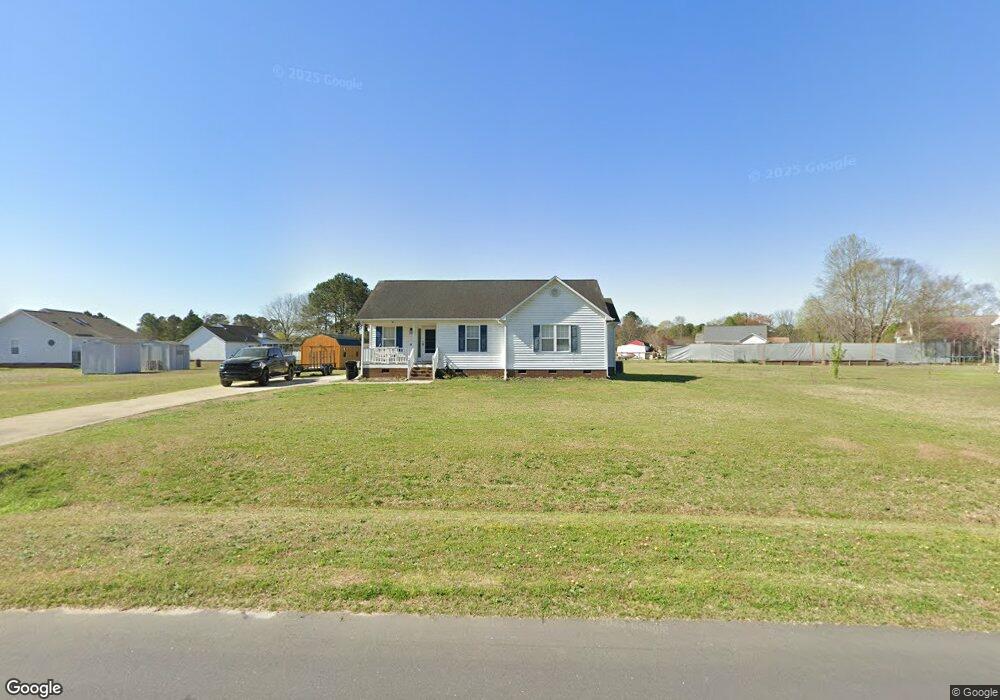
505 Lazy Branch Dr Benson, NC 27504
Pleasant Grove NeighborhoodEstimated Value: $298,000 - $306,000
3
Beds
2
Baths
1,328
Sq Ft
$227/Sq Ft
Est. Value
About This Home
This home is located at 505 Lazy Branch Dr, Benson, NC 27504 and is currently estimated at $302,090, approximately $227 per square foot. 505 Lazy Branch Dr is a home located in Johnston County with nearby schools including McGee's Crossroads Elementary School, McGee's Crossroads Middle School, and West Johnston High School.
Ownership History
Date
Name
Owned For
Owner Type
Purchase Details
Closed on
Oct 25, 2019
Sold by
Moody Quenaisha and Powell Quenaisha
Bought by
Powell Terrell M
Current Estimated Value
Purchase Details
Closed on
Jun 14, 2010
Sold by
Edmondson G Michael and Edmondson Katie S
Bought by
Powell Terrell M and Powell Quenaisha A
Home Financials for this Owner
Home Financials are based on the most recent Mortgage that was taken out on this home.
Original Mortgage
$117,911
Outstanding Balance
$81,050
Interest Rate
5.5%
Mortgage Type
FHA
Estimated Equity
$221,040
Purchase Details
Closed on
Jun 4, 2008
Sold by
Edmondson G Michael
Bought by
Edmondson G Michael and Edmondson Katie S
Create a Home Valuation Report for This Property
The Home Valuation Report is an in-depth analysis detailing your home's value as well as a comparison with similar homes in the area
Home Values in the Area
Average Home Value in this Area
Purchase History
We collect this data history from publicly available records. To have your information removed, we recommend requesting removal directly through your county’s website.
| Date | Buyer | Sale Price | Title Company |
|---|---|---|---|
| Powell Terrell M | -- | None Available | |
| Powell Terrell M | $119,500 | None Available | |
| Edmondson G Michael | -- | None Available |
Source: Public Records
Mortgage History
We collect this data history from publicly available records. To have your information removed, we recommend requesting removal directly through your county’s website.
| Date | Status | Borrower | Loan Amount |
|---|---|---|---|
| Open | Powell Terrell M | $117,911 |
Source: Public Records
Tax History
| Year | Tax Paid | Tax Assessment Tax Assessment Total Assessment is a certain percentage of the fair market value that is determined by local assessors to be the total taxable value of land and additions on the property. | Land | Improvement |
|---|---|---|---|---|
| 2025 | $1,831 | $288,270 | $85,000 | $203,270 |
| 2024 | $1,322 | $163,170 | $44,000 | $119,170 |
| 2023 | $1,281 | $163,170 | $44,000 | $119,170 |
| 2022 | $1,322 | $163,170 | $44,000 | $119,170 |
| 2021 | $1,322 | $163,170 | $44,000 | $119,170 |
| 2020 | $1,371 | $163,170 | $44,000 | $119,170 |
| 2019 | $1,338 | $163,170 | $44,000 | $119,170 |
| 2018 | $936 | $111,380 | $27,500 | $83,880 |
| 2017 | $936 | $111,380 | $27,500 | $83,880 |
| 2016 | $936 | $111,380 | $27,500 | $83,880 |
| 2015 | $936 | $111,380 | $27,500 | $83,880 |
| 2014 | $936 | $111,380 | $27,500 | $83,880 |
Source: Public Records
Map
Nearby Homes
- 709 Slippery Bank Ct
- 717 Slippery Bank Ct
- 370 Sanders Rd
- 512 Rockvale Ct
- 50 Sanders Rd
- 307 William Dr
- 22 Willard Wood Run
- 1190 Sanders Rd
- 381 Gray Ghost St
- 203 Lansing Dr
- 70 Hot Springs Way
- 104 Hot Springs Way
- 198 Hot Springs Way
- 183 Hot Springs Way
- 271 Busterfield Ct
- 375 Pond Mountain Dr
- 111 Valleydale Dr
- 26 Valleydale Dr
- 17 Barton Bay Ln
- 10 Roping Horn Way
- 600 Meander Way
- 509 Lazy Branch Dr
- 610 Meander Way
- 513 Lazy Branch Dr
- 605 Meander Way
- 601 Meander Way
- 710 Slippery Bank Ct
- 716 Slippery Bank Ct
- 704 Slippery Bank Ct
- 412 Lazy Branch Dr
- 614 Meander Way
- 609 Meander Way
- 100 White Falls Cir
- 408 Lazy Branch Dr
- 720 Slippery Bank Ct
- 101 Eddy Ct
- 613 Meander Way
- 403 Lazy Branch Dr
- 104 White Falls Cir
- 106 White Falls Cir
Your Personal Tour Guide
Ask me questions while you tour the home.