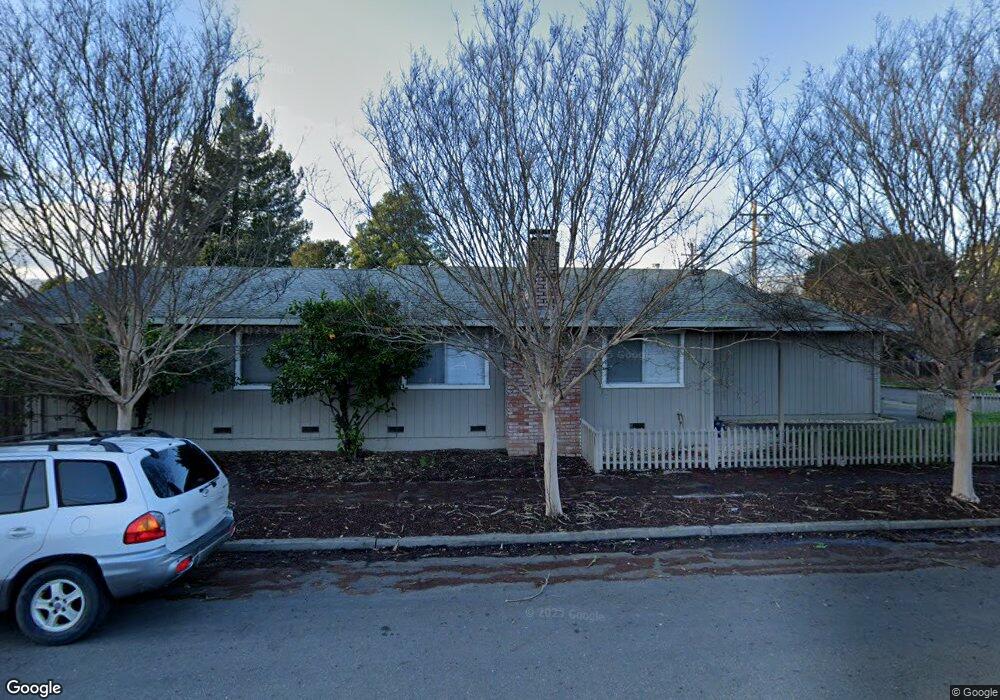
505 Madison St Santa Rosa, CA 95401
Historic Railroad Square NeighborhoodEstimated Value: $535,041 - $564,000
3
Beds
1
Bath
1,222
Sq Ft
$454/Sq Ft
Est. Value
About This Home
This home is located at 505 Madison St, Santa Rosa, CA 95401 and is currently estimated at $554,510, approximately $453 per square foot. 505 Madison St is a home located in Sonoma County with nearby schools including Abraham Lincoln Elementary School, Santa Rosa Middle School, and Santa Rosa High School.
Ownership History
Date
Name
Owned For
Owner Type
Purchase Details
Closed on
Oct 13, 2009
Sold by
Steckman John W and Steckman Patricia A
Bought by
Steckman John W and Steckman Patricia A
Current Estimated Value
Purchase Details
Closed on
Dec 11, 1995
Sold by
Steckman John W and Steckman John William
Bought by
Steckman John W and Steckman Patricia A
Home Financials for this Owner
Home Financials are based on the most recent Mortgage that was taken out on this home.
Original Mortgage
$57,000
Outstanding Balance
$1,177
Interest Rate
7.47%
Estimated Equity
$553,333
Purchase Details
Closed on
Sep 9, 1993
Sold by
Steckman John William
Bought by
Steckman John William
Home Financials for this Owner
Home Financials are based on the most recent Mortgage that was taken out on this home.
Original Mortgage
$54,500
Interest Rate
5.6%
Create a Home Valuation Report for This Property
The Home Valuation Report is an in-depth analysis detailing your home's value as well as a comparison with similar homes in the area
Home Values in the Area
Average Home Value in this Area
Purchase History
| Date | Buyer | Sale Price | Title Company |
|---|---|---|---|
| Steckman John W | -- | None Available | |
| Steckman John W | -- | Chicago Title Co | |
| Steckman John William | -- | North Bay Title Co |
Source: Public Records
Mortgage History
| Date | Status | Borrower | Loan Amount |
|---|---|---|---|
| Open | Steckman John W | $57,000 | |
| Previous Owner | Steckman John William | $54,500 |
Source: Public Records
Tax History Compared to Growth
Tax History
| Year | Tax Paid | Tax Assessment Tax Assessment Total Assessment is a certain percentage of the fair market value that is determined by local assessors to be the total taxable value of land and additions on the property. | Land | Improvement |
|---|---|---|---|---|
| 2025 | $1,636 | $142,089 | $45,283 | $96,806 |
| 2024 | $1,636 | $139,304 | $44,396 | $94,908 |
| 2023 | $1,636 | $136,574 | $43,526 | $93,048 |
| 2022 | $1,512 | $133,897 | $42,673 | $91,224 |
| 2021 | $1,494 | $131,273 | $41,837 | $89,436 |
| 2020 | $1,491 | $129,928 | $41,409 | $88,519 |
| 2019 | $1,483 | $127,382 | $40,598 | $86,784 |
| 2018 | $1,474 | $124,885 | $39,802 | $85,083 |
| 2017 | $1,448 | $122,437 | $39,022 | $83,415 |
| 2016 | $1,429 | $120,037 | $38,257 | $81,780 |
| 2015 | $1,387 | $118,235 | $37,683 | $80,552 |
| 2014 | $1,303 | $115,920 | $36,945 | $78,975 |
Source: Public Records
Map
Nearby Homes