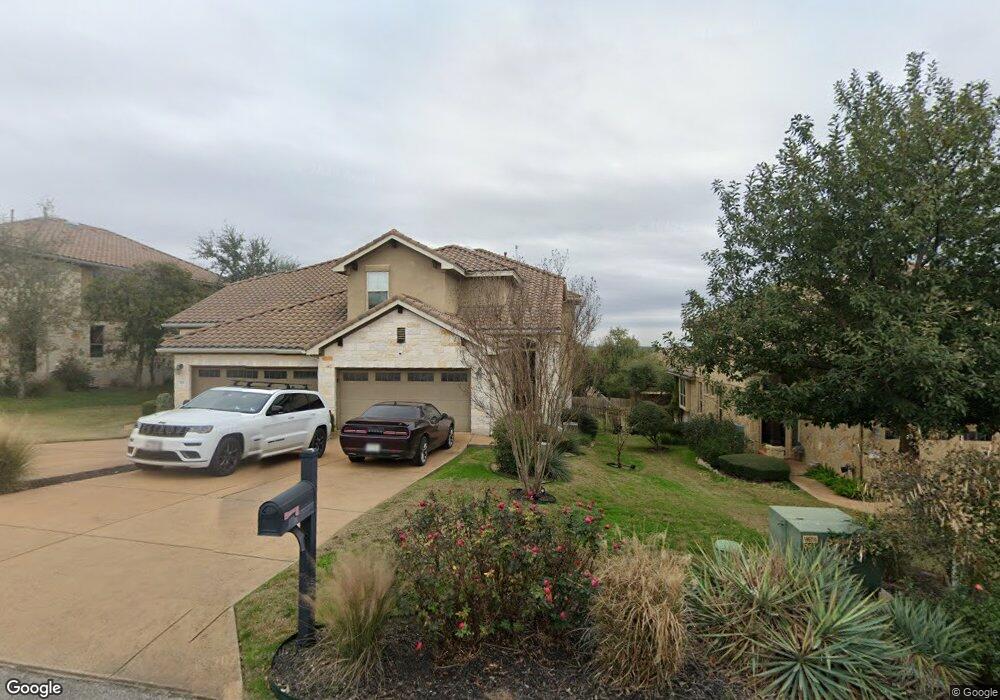
505 Meadowlark St Unit B Lakeway, TX 78734
Apache Shores NeighborhoodEstimated Value: $502,652 - $628,000
3
Beds
3
Baths
2,632
Sq Ft
$213/Sq Ft
Est. Value
About This Home
This home is located at 505 Meadowlark St Unit B, Lakeway, TX 78734 and is currently estimated at $561,663, approximately $213 per square foot. 505 Meadowlark St Unit B is a home located in Travis County with nearby schools including Lake Travis Elementary School, Hudson Bend Middle School, and Lake Travis High School.
Ownership History
Date
Name
Owned For
Owner Type
Purchase Details
Closed on
May 3, 2019
Sold by
Buddorf Alan and Buddorf Phyllis
Bought by
Peloquin Joseph
Current Estimated Value
Home Financials for this Owner
Home Financials are based on the most recent Mortgage that was taken out on this home.
Original Mortgage
$284,000
Outstanding Balance
$245,326
Interest Rate
3.37%
Mortgage Type
Adjustable Rate Mortgage/ARM
Estimated Equity
$316,337
Purchase Details
Closed on
Jan 30, 2017
Sold by
Childers Clinotn C and Childers Tammy
Bought by
Boddof Alan and Boddof Phylis
Purchase Details
Closed on
Feb 25, 2014
Sold by
Continental Homes Of Texas Lp
Bought by
Childers Clinton C and Childers Tammy
Home Financials for this Owner
Home Financials are based on the most recent Mortgage that was taken out on this home.
Original Mortgage
$221,200
Interest Rate
4.47%
Mortgage Type
New Conventional
Create a Home Valuation Report for This Property
The Home Valuation Report is an in-depth analysis detailing your home's value as well as a comparison with similar homes in the area
Home Values in the Area
Average Home Value in this Area
Purchase History
| Date | Buyer | Sale Price | Title Company |
|---|---|---|---|
| Peloquin Joseph | -- | Capstone Title | |
| Peloquin Joseph | -- | Capstone Title | |
| Boddof Alan | -- | None Available | |
| Childers Clinton C | -- | None Available |
Source: Public Records
Mortgage History
| Date | Status | Borrower | Loan Amount |
|---|---|---|---|
| Open | Peloquin Joseph | $284,000 | |
| Closed | Peloquin Joseph | $284,000 | |
| Previous Owner | Childers Clinton C | $221,200 |
Source: Public Records
Tax History Compared to Growth
Tax History
| Year | Tax Paid | Tax Assessment Tax Assessment Total Assessment is a certain percentage of the fair market value that is determined by local assessors to be the total taxable value of land and additions on the property. | Land | Improvement |
|---|---|---|---|---|
| 2025 | $7,876 | $505,637 | $55,330 | $450,307 |
| 2023 | $10,407 | $644,063 | $55,330 | $588,733 |
| 2022 | $11,962 | $675,830 | $66,396 | $609,434 |
| 2021 | $7,482 | $403,127 | $66,396 | $336,731 |
| 2020 | $7,379 | $374,160 | $55,330 | $318,830 |
| 2018 | $8,551 | $418,375 | $55,330 | $363,045 |
| 2017 | $6,955 | $337,343 | $55,330 | $314,796 |
| 2016 | $6,323 | $306,675 | $39,961 | $266,714 |
| 2015 | -- | $303,842 | $39,961 | $263,881 |
Source: Public Records
Map
Nearby Homes
- 400 Hummingbird Ln Unit A
- 15104 S Flamingo Dr
- 509 Heron Dr
- 506 Bella Montagna Cir
- 111 Piazza Vetta Dr
- 15104 Sun-Bird Ln
- 514 Bella Montagna Cir
- 208 Palazza Alto Dr
- 516 Bella Montagna Cir
- 106 Bella Montagna Cir
- 206 Palazza Alto Dr
- 205 Palazza Alto Dr
- 301 Crane St
- 15100 Falcon Dr
- 15101 Barrie Dr
- 104 S Meadowlark St
- 102 S Meadowlark St
- 407 Bella Montagna Cir
- 15006 Nightingale Ln
- 15101 Joseph Dr
- 505 Meadowlark St Unit A
- 505 S Meadowlark St
- 503 N Meadowlark St Unit B
- 503 N Meadowlark St
- 503 S Meadowlark St Unit 1B
- 503 S Meadowlark St Unit B
- 503 Meadowlark St Unit B
- 507 S Meadowlark St
- 507 S Meadowlark St Unit A
- 507 S Meadowlark St Unit B
- 507 Meadowlark St Unit B
- 507 Meadowlark St Unit A
- 504 Hummingbird Ln Unit A
- 504 Hummingbird Ln Unit B
- 504 Hummingbird Ln
- 502B Hummingbird Ln Unit 2
- 502 Hummingbird Ln Unit B
- 502 Hummingbird Ln Unit 2
- 501 S Meadowlark St Unit A
- 506 Hummingbird Ln Unit A