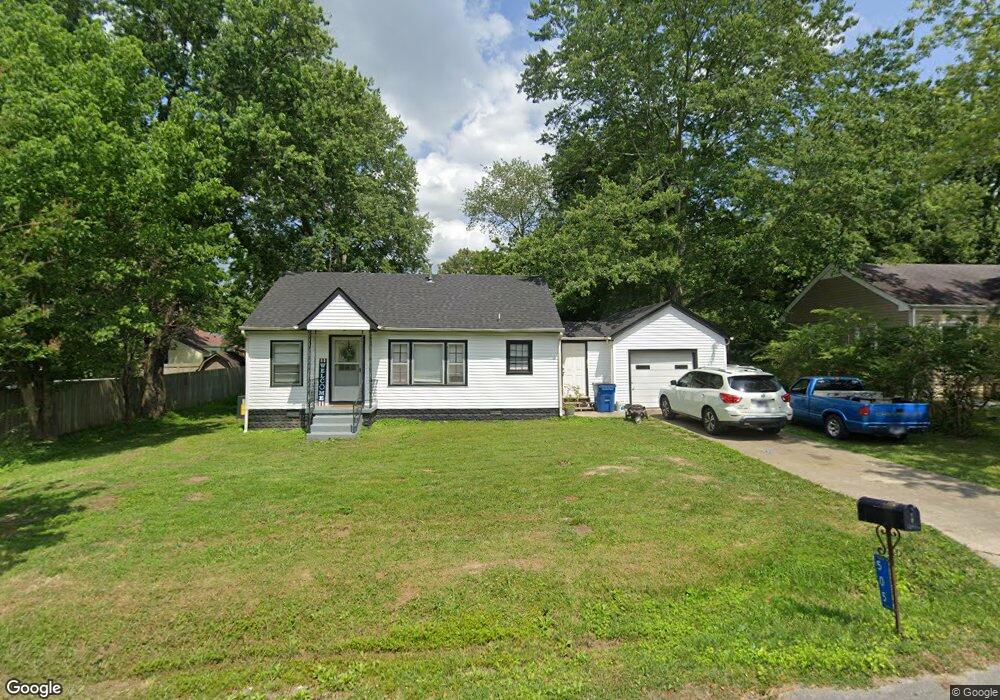
505 Noel Ave Manchester, TN 37355
Estimated Value: $108,000 - $173,000
--
Bed
1
Bath
792
Sq Ft
$185/Sq Ft
Est. Value
About This Home
This home is located at 505 Noel Ave, Manchester, TN 37355 and is currently estimated at $146,823, approximately $185 per square foot. 505 Noel Ave is a home located in Coffee County with nearby schools including Westwood Middle School and Temple Baptist Christian School.
Ownership History
Date
Name
Owned For
Owner Type
Purchase Details
Closed on
Jan 17, 2020
Sold by
Sissom Joe Dale
Bought by
Brown Brian B and Brown Judith A
Current Estimated Value
Home Financials for this Owner
Home Financials are based on the most recent Mortgage that was taken out on this home.
Original Mortgage
$38,800
Outstanding Balance
$34,281
Interest Rate
3.6%
Mortgage Type
Unknown
Estimated Equity
$112,542
Purchase Details
Closed on
Sep 21, 2018
Sold by
Limbaugh Jessica Lee
Bought by
Sissom Joe Dale
Purchase Details
Closed on
Aug 22, 2018
Sold by
Limbaugh Michael Tomlin
Bought by
Limbaugh Jessica Lee
Purchase Details
Closed on
Jul 12, 2007
Sold by
Reynolds Glenn B
Bought by
Jones Jessica L
Purchase Details
Closed on
Aug 24, 1990
Bought by
Reynolds Glenn B
Purchase Details
Closed on
Aug 20, 1990
Bought by
Farrar E R
Purchase Details
Closed on
Apr 9, 1987
Create a Home Valuation Report for This Property
The Home Valuation Report is an in-depth analysis detailing your home's value as well as a comparison with similar homes in the area
Home Values in the Area
Average Home Value in this Area
Purchase History
| Date | Buyer | Sale Price | Title Company |
|---|---|---|---|
| Brown Brian B | $45,750 | None Available | |
| Sissom Joe Dale | $41,000 | Bell & Alexander Title | |
| Limbaugh Jessica Lee | -- | None Available | |
| Jones Jessica L | $41,500 | -- | |
| Reynolds Glenn B | $20,000 | -- | |
| Farrar E R | $23,000 | -- | |
| -- | $23,000 | -- |
Source: Public Records
Mortgage History
| Date | Status | Borrower | Loan Amount |
|---|---|---|---|
| Open | Brown Brian B | $38,800 |
Source: Public Records
Tax History Compared to Growth
Tax History
| Year | Tax Paid | Tax Assessment Tax Assessment Total Assessment is a certain percentage of the fair market value that is determined by local assessors to be the total taxable value of land and additions on the property. | Land | Improvement |
|---|---|---|---|---|
| 2024 | $572 | $13,550 | $2,700 | $10,850 |
| 2023 | $572 | $13,550 | $0 | $0 |
| 2022 | $492 | $13,550 | $2,700 | $10,850 |
| 2021 | $497 | $10,850 | $2,250 | $8,600 |
| 2020 | $497 | $10,850 | $2,250 | $8,600 |
| 2019 | $497 | $10,850 | $2,250 | $8,600 |
| 2018 | $497 | $10,850 | $2,250 | $8,600 |
| 2017 | $520 | $9,925 | $2,250 | $7,675 |
| 2016 | $520 | $9,925 | $2,250 | $7,675 |
| 2015 | $521 | $9,925 | $2,250 | $7,675 |
| 2014 | $521 | $9,929 | $0 | $0 |
Source: Public Records
Map
Nearby Homes
- 509 Noel Ave
- 501 Noel Ave
- 405 Riverside Dr
- 404 W Short St
- 513 Noel Ave
- 506 Noel Ave
- 504 Woodrow St
- 506 Woodrow St
- 500 Noel Ave
- 500 Woodrow St
- 512 Noel Ave
- 510 Woodrow St
- 505 Riverside Dr
- 500 Riverside Dr
- 402 Riverside Dr
- 504 W Short St
- 502 Riverside Dr
- 400 Riverside Dr
- 511 Woodrow St Unit 511
- 407 W Short St