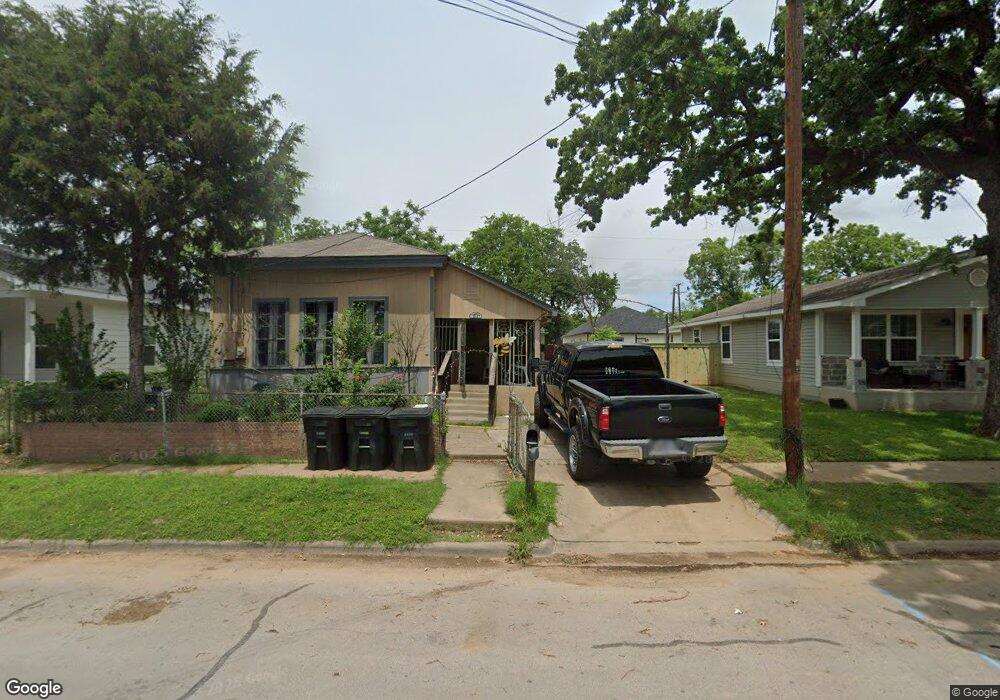
505 Olive St Cleburne, TX 76031
Estimated Value: $174,000 - $235,000
3
Beds
1
Bath
1,542
Sq Ft
$133/Sq Ft
Est. Value
About This Home
This home is located at 505 Olive St, Cleburne, TX 76031 and is currently estimated at $205,740, approximately $133 per square foot. 505 Olive St is a home located in Johnson County with nearby schools including Santa Fe Elementary School, Lowell Smith Jr. Middle School, and Cleburne High School.
Ownership History
Date
Name
Owned For
Owner Type
Purchase Details
Closed on
May 3, 2022
Sold by
Rosa Davila
Bought by
Reyes Carolina
Current Estimated Value
Purchase Details
Closed on
Jan 1, 2006
Sold by
Panda Land Llc
Bought by
Ramirez Jose and Ramirez Anna
Home Financials for this Owner
Home Financials are based on the most recent Mortgage that was taken out on this home.
Original Mortgage
$27,995
Interest Rate
6.41%
Mortgage Type
Seller Take Back
Create a Home Valuation Report for This Property
The Home Valuation Report is an in-depth analysis detailing your home's value as well as a comparison with similar homes in the area
Home Values in the Area
Average Home Value in this Area
Purchase History
| Date | Buyer | Sale Price | Title Company |
|---|---|---|---|
| Reyes Carolina | -- | New Title Company Name | |
| Ramirez Jose | -- | None Available |
Source: Public Records
Mortgage History
| Date | Status | Borrower | Loan Amount |
|---|---|---|---|
| Previous Owner | Ramirez Jose | $27,995 |
Source: Public Records
Tax History
| Year | Tax Paid | Tax Assessment Tax Assessment Total Assessment is a certain percentage of the fair market value that is determined by local assessors to be the total taxable value of land and additions on the property. | Land | Improvement |
|---|---|---|---|---|
| 2025 | $2,139 | $161,214 | $43,000 | $118,214 |
| 2024 | $3,476 | $155,885 | $0 | $0 |
| 2023 | $3,154 | $141,714 | $23,500 | $118,214 |
| 2022 | $3,547 | $141,714 | $23,500 | $118,214 |
| 2021 | $3,697 | $141,714 | $23,500 | $118,214 |
| 2020 | $2,352 | $84,864 | $20,000 | $64,864 |
| 2019 | $2,508 | $84,864 | $20,000 | $64,864 |
| 2018 | $1,529 | $51,718 | $7,500 | $44,218 |
| 2017 | $1,522 | $51,718 | $7,500 | $44,218 |
| 2016 | $1,522 | $51,718 | $7,500 | $44,218 |
| 2015 | $1,271 | $51,718 | $7,500 | $44,218 |
| 2014 | $1,271 | $47,675 | $7,500 | $40,175 |
Source: Public Records
Map
Nearby Homes
- 605 Olive St
- 603 E Willingham St
- 731 E Brown St
- 601 E Willingham St
- 938 E Henderson St
- 109 N Kouns St
- 106 Columbia St
- 1024 Alvarado St
- 426 Sabine Ave
- 201 Grandview St
- 123 Wells St
- 1300 N Brazos Ave
- 821 E Brown St
- 430 Sabine Ave
- 433 Sabine Ave
- 407 E Willingham St
- 419 E Henderson St
- 306 Lewis St
- 1126 Alvarado St
- 308 Lewis St
Your Personal Tour Guide
Ask me questions while you tour the home.