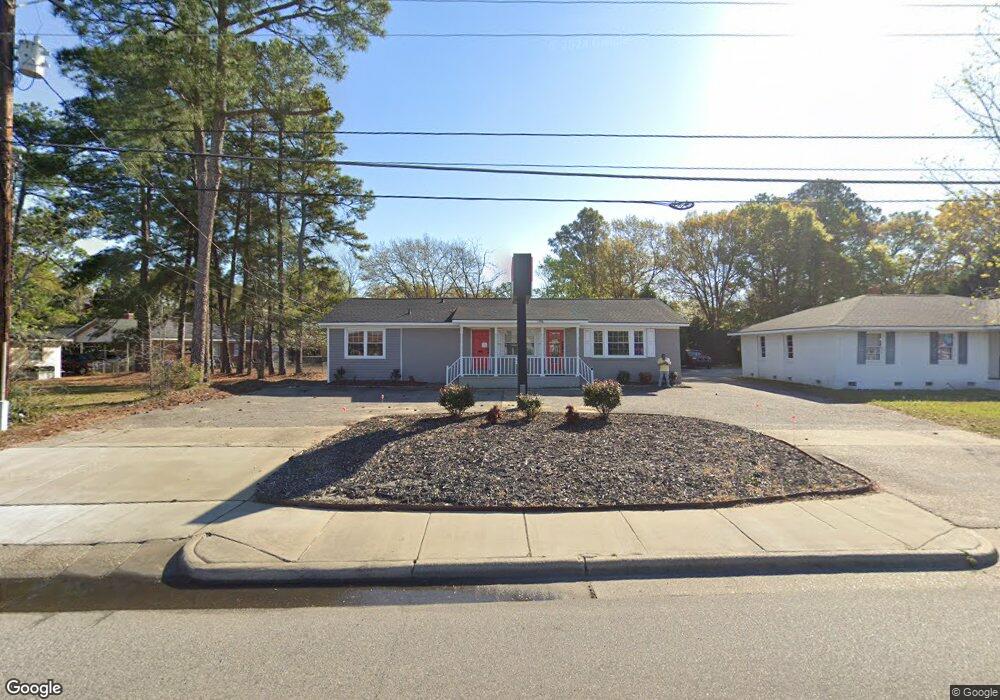
505 Owen Dr Fayetteville, NC 28304
Terry Sanford NeighborhoodEstimated Value: $463,278
3
Beds
2
Baths
1,334
Sq Ft
$347/Sq Ft
Est. Value
About This Home
This home is located at 505 Owen Dr, Fayetteville, NC 28304 and is currently estimated at $463,278, approximately $347 per square foot. 505 Owen Dr is a home located in Cumberland County with nearby schools including Glendale Acres Elementary, Ashley Elementary, and R. Max Abbott Middle School.
Ownership History
Date
Name
Owned For
Owner Type
Purchase Details
Closed on
Mar 7, 2019
Sold by
Alabaster David B and Alabaster Diane M
Bought by
Heiman Daniel J and Heiman Kathy C
Current Estimated Value
Home Financials for this Owner
Home Financials are based on the most recent Mortgage that was taken out on this home.
Original Mortgage
$229,000
Outstanding Balance
$200,920
Interest Rate
4.3%
Mortgage Type
New Conventional
Estimated Equity
$262,358
Purchase Details
Closed on
Jan 7, 2014
Sold by
Alabaster David B and Alabaster Diane M
Bought by
Alabaster David B and Alabaster Diane M
Create a Home Valuation Report for This Property
The Home Valuation Report is an in-depth analysis detailing your home's value as well as a comparison with similar homes in the area
Home Values in the Area
Average Home Value in this Area
Purchase History
| Date | Buyer | Sale Price | Title Company |
|---|---|---|---|
| Heiman Daniel J | $239,000 | Attorney | |
| Alabaster David B | -- | -- |
Source: Public Records
Mortgage History
| Date | Status | Borrower | Loan Amount |
|---|---|---|---|
| Open | Heiman Daniel J | $229,000 |
Source: Public Records
Tax History Compared to Growth
Tax History
| Year | Tax Paid | Tax Assessment Tax Assessment Total Assessment is a certain percentage of the fair market value that is determined by local assessors to be the total taxable value of land and additions on the property. | Land | Improvement |
|---|---|---|---|---|
| 2024 | $3,792 | $244,030 | $146,943 | $97,087 |
| 2023 | $4,273 | $244,030 | $146,943 | $97,087 |
| 2022 | $3,882 | $244,030 | $146,943 | $97,087 |
| 2021 | $3,882 | $244,030 | $146,943 | $97,087 |
| 2019 | $3,847 | $244,030 | $146,943 | $97,087 |
| 2018 | $3,847 | $244,030 | $146,943 | $97,087 |
| 2017 | $3,639 | $244,030 | $146,943 | $97,087 |
| 2016 | $2,774 | $194,625 | $40,165 | $154,460 |
| 2015 | $2,748 | $194,625 | $40,165 | $154,460 |
| 2014 | $2,726 | $194,625 | $100,413 | $94,212 |
Source: Public Records
Map
Nearby Homes