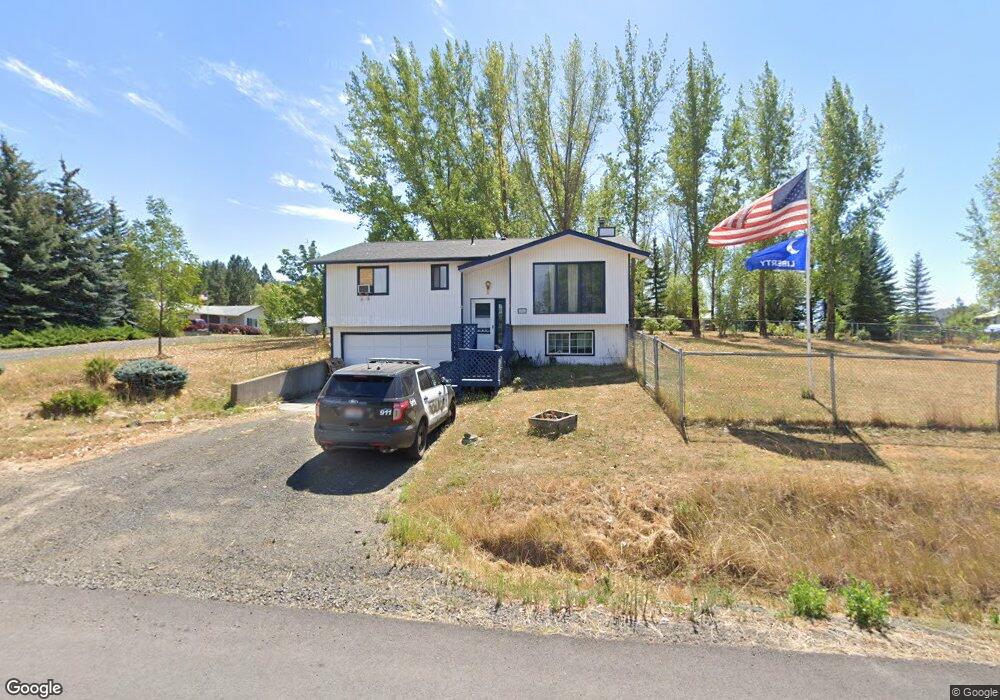
505 Pine St Plummer, ID 83851
Estimated Value: $384,000 - $491,000
5
Beds
3
Baths
2,340
Sq Ft
$192/Sq Ft
Est. Value
About This Home
This home is located at 505 Pine St, Plummer, ID 83851 and is currently estimated at $448,183, approximately $191 per square foot. 505 Pine St is a home located in Benewah County with nearby schools including Lakeside Elementary School, Lakeside Jr High School, and Lakeside High School.
Ownership History
Date
Name
Owned For
Owner Type
Purchase Details
Closed on
Aug 12, 2025
Sold by
Taylor Philip James and Taylor Joanna C
Bought by
Taylor Philip James and Taylor Joanna C
Current Estimated Value
Home Financials for this Owner
Home Financials are based on the most recent Mortgage that was taken out on this home.
Original Mortgage
$130,000
Outstanding Balance
$129,889
Interest Rate
6.77%
Mortgage Type
Credit Line Revolving
Estimated Equity
$318,294
Purchase Details
Closed on
Jun 1, 2018
Sold by
Wienclaw Leona M
Bought by
Taylor Philip James and Taylor Joanna C
Home Financials for this Owner
Home Financials are based on the most recent Mortgage that was taken out on this home.
Original Mortgage
$181,390
Interest Rate
4.5%
Mortgage Type
New Conventional
Purchase Details
Closed on
May 30, 2007
Sold by
Friesen Thomas Eugene and Friesen Leona Marie
Bought by
Wienclaw Leona M
Create a Home Valuation Report for This Property
The Home Valuation Report is an in-depth analysis detailing your home's value as well as a comparison with similar homes in the area
Purchase History
| Date | Buyer | Sale Price | Title Company |
|---|---|---|---|
| Taylor Philip James | -- | None Listed On Document | |
| Taylor Philip James | -- | First American Title | |
| Wienclaw Leona M | -- | -- |
Source: Public Records
Mortgage History
| Date | Status | Borrower | Loan Amount |
|---|---|---|---|
| Open | Taylor Philip James | $130,000 | |
| Previous Owner | Taylor Philip James | $181,390 |
Source: Public Records
Tax History
| Year | Tax Paid | Tax Assessment Tax Assessment Total Assessment is a certain percentage of the fair market value that is determined by local assessors to be the total taxable value of land and additions on the property. | Land | Improvement |
|---|---|---|---|---|
| 2025 | $1,537 | $333,050 | $35,200 | $297,850 |
| 2024 | $1,537 | $352,125 | $35,200 | $316,925 |
| 2023 | $1,296 | $308,095 | $35,200 | $272,895 |
| 2022 | $1,496 | $296,755 | $35,200 | $261,555 |
| 2021 | $1,256 | $173,308 | $21,110 | $152,198 |
| 2020 | $1,359 | $168,242 | $21,110 | $147,132 |
| 2019 | $928 | $133,818 | $18,060 | $115,758 |
| 2018 | $1,747 | $134,530 | $18,060 | $116,470 |
| 2017 | $865 | $115,370 | $18,620 | $96,750 |
| 2016 | $883 | $118,552 | $18,620 | $99,932 |
| 2015 | $915 | $122,632 | $22,700 | $99,932 |
| 2014 | -- | $124,480 | $22,700 | $101,780 |
| 2013 | -- | $124,480 | $22,700 | $101,780 |
Source: Public Records
Map
Nearby Homes
Your Personal Tour Guide
Ask me questions while you tour the home.