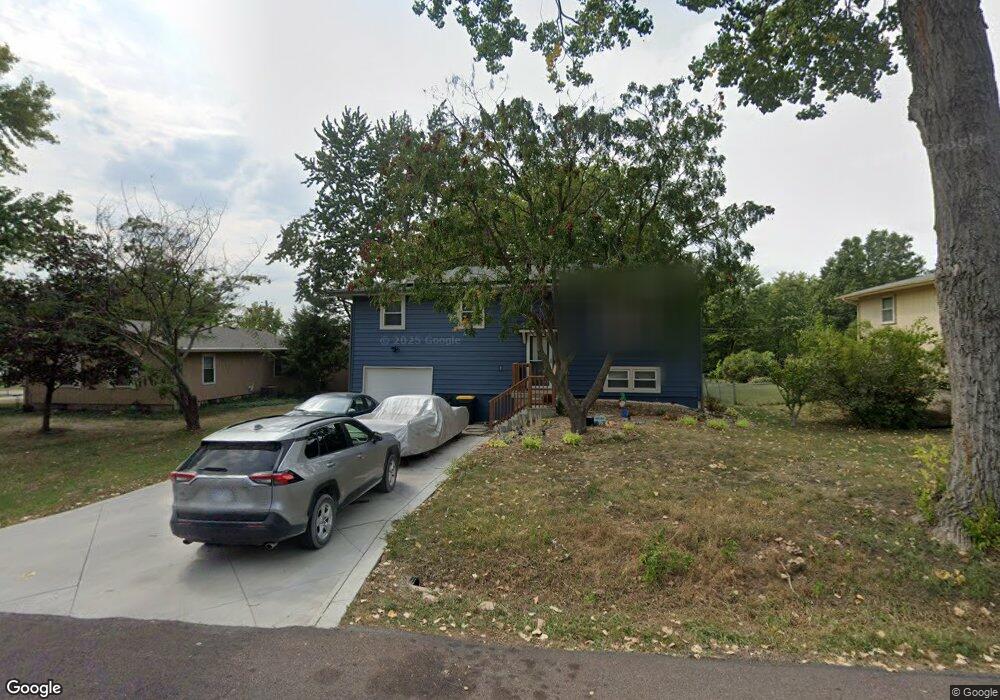
505 S Jefferson St Spring Hill, KS 66083
Estimated Value: $259,264 - $290,000
3
Beds
2
Baths
1,008
Sq Ft
$274/Sq Ft
Est. Value
About This Home
This home is located at 505 S Jefferson St, Spring Hill, KS 66083 and is currently estimated at $275,816, approximately $273 per square foot. 505 S Jefferson St is a home located in Johnson County with nearby schools including Spring Hill Elementary School, Spring Hill Middle School, and Spring Hill High School.
Ownership History
Date
Name
Owned For
Owner Type
Purchase Details
Closed on
Dec 26, 2012
Sold by
Thomas Tommy D and Thomas Brandy
Bought by
Thomas Tommy D and Thomas Brandy
Current Estimated Value
Home Financials for this Owner
Home Financials are based on the most recent Mortgage that was taken out on this home.
Original Mortgage
$90,537
Outstanding Balance
$54,235
Interest Rate
3.5%
Mortgage Type
FHA
Estimated Equity
$221,581
Purchase Details
Closed on
May 27, 2003
Sold by
Pritchard Elizabeth A and Pritchard David W
Bought by
Thomas Tommy D
Home Financials for this Owner
Home Financials are based on the most recent Mortgage that was taken out on this home.
Original Mortgage
$111,122
Interest Rate
5.79%
Mortgage Type
FHA
Purchase Details
Closed on
Oct 10, 2001
Sold by
Riley Jeffrey Alan
Bought by
Riley Elizabeth Ann
Create a Home Valuation Report for This Property
The Home Valuation Report is an in-depth analysis detailing your home's value as well as a comparison with similar homes in the area
Home Values in the Area
Average Home Value in this Area
Purchase History
| Date | Buyer | Sale Price | Title Company |
|---|---|---|---|
| Thomas Tommy D | -- | All American Title Co | |
| Thomas Tommy D | -- | Stewart Title Inc | |
| Riley Elizabeth Ann | -- | -- |
Source: Public Records
Mortgage History
| Date | Status | Borrower | Loan Amount |
|---|---|---|---|
| Open | Thomas Tommy D | $90,537 | |
| Closed | Thomas Tommy D | $111,122 |
Source: Public Records
Tax History Compared to Growth
Tax History
| Year | Tax Paid | Tax Assessment Tax Assessment Total Assessment is a certain percentage of the fair market value that is determined by local assessors to be the total taxable value of land and additions on the property. | Land | Improvement |
|---|---|---|---|---|
| 2024 | $3,710 | $27,002 | $4,937 | $22,065 |
| 2023 | $3,485 | $25,450 | $4,937 | $20,513 |
| 2022 | $3,044 | $22,218 | $4,488 | $17,730 |
| 2021 | $2,813 | $19,987 | $3,590 | $16,397 |
| 2020 | $2,784 | $19,240 | $3,263 | $15,977 |
| 2019 | $2,620 | $18,101 | $2,838 | $15,263 |
| 2018 | $2,357 | $16,824 | $2,838 | $13,986 |
| 2017 | $2,176 | $15,421 | $2,838 | $12,583 |
| 2016 | $1,942 | $13,857 | $2,838 | $11,019 |
| 2015 | $1,895 | $13,512 | $2,838 | $10,674 |
| 2013 | -- | $12,742 | $2,838 | $9,904 |
Source: Public Records
Map
Nearby Homes
- Lot 7 Kilmer Rd
- 20934 Cottonwood Cir
- 0 W 215th St Unit HMS2527844
- 303 S Jackson St
- 21735 S Madison St
- 21745 Madison St
- 21740 S Madison St
- 606 S Race St
- 21750 Madison St
- 204 N Madison St
- 109 N Harrison St
- ALDRIDGE Plan at Maplewood Valley
- BELLAMY Plan at Maplewood Valley
- NEWCASTLE Plan at Maplewood Valley
- HARMONY Plan at Maplewood Valley
- 108 W Lawrence St
- 512 W Lawrence Ave
- 508 W Lawrence Ave
- 514 W Lawrence Ave
- 21845 Franklin St
- 302 W South St
- 503 S Jefferson St
- 501 S Jefferson St
- 208 W South St
- 506 S Washington St
- 508 S Washington St
- 502 S Washington St
- 301 W South St
- 414 S Jefferson St
- 206 W South St
- 500 S Washington St
- 207 W South St
- 412 S Jefferson St
- 307 W South St
- 205 W South St
- 410 S Jefferson St
- 408 S Washington St
- 20930 Maple Terrace
- 505 S Madison St
- 405 S Jefferson St