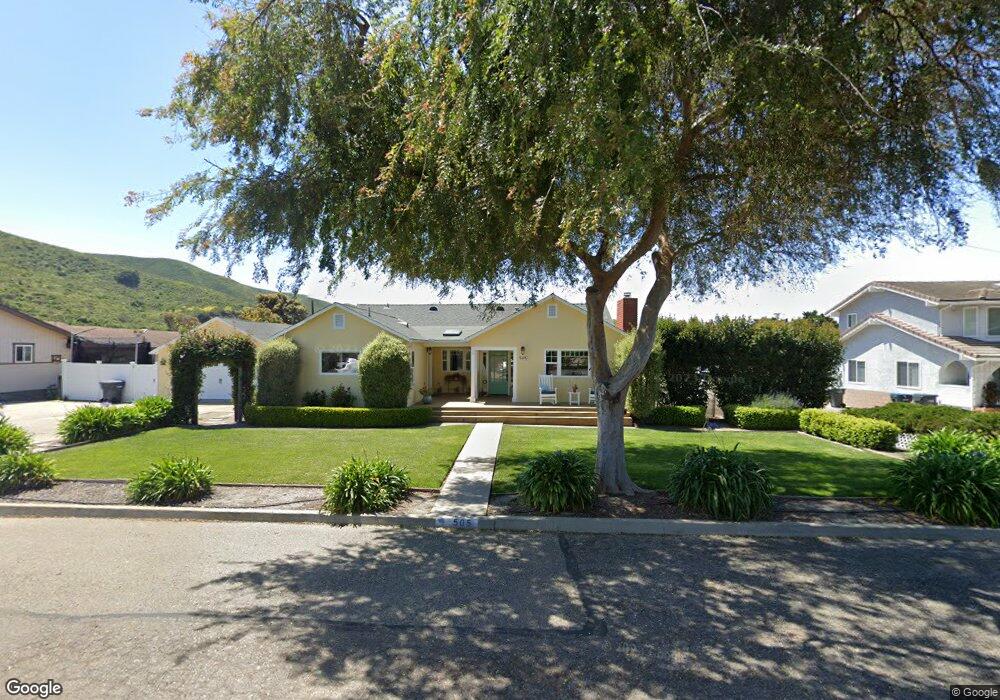
505 S M St Lompoc, CA 93436
Estimated Value: $661,000 - $923,000
3
Beds
2
Baths
1,705
Sq Ft
$483/Sq Ft
Est. Value
About This Home
This home is located at 505 S M St, Lompoc, CA 93436 and is currently estimated at $824,202, approximately $483 per square foot. 505 S M St is a home located in Santa Barbara County with nearby schools including Miguelito Elementary School, Lompoc Valley Middle School, and Lompoc High School.
Ownership History
Date
Name
Owned For
Owner Type
Purchase Details
Closed on
Apr 25, 2018
Sold by
Holloway Eugene E and Holloway Patricia J
Bought by
Olson Jordon C and Olson Shannon R
Current Estimated Value
Home Financials for this Owner
Home Financials are based on the most recent Mortgage that was taken out on this home.
Original Mortgage
$392,000
Interest Rate
4.5%
Mortgage Type
New Conventional
Purchase Details
Closed on
Nov 12, 2013
Sold by
Cooley Judith Holloway
Bought by
Holloway Eugene E and Holloway Patricia J
Home Financials for this Owner
Home Financials are based on the most recent Mortgage that was taken out on this home.
Original Mortgage
$201,500
Interest Rate
4.08%
Mortgage Type
New Conventional
Purchase Details
Closed on
Feb 17, 1998
Sold by
Holloway Erwin M and Holloway Leona M
Bought by
Holloway Erwin M and Holloway Leona Mae
Create a Home Valuation Report for This Property
The Home Valuation Report is an in-depth analysis detailing your home's value as well as a comparison with similar homes in the area
Home Values in the Area
Average Home Value in this Area
Purchase History
| Date | Buyer | Sale Price | Title Company |
|---|---|---|---|
| Olson Jordon C | $490,000 | Fidelity National Title Co | |
| Holloway Eugene E | $270,000 | Fidelity National Title Co | |
| Holloway Erwin M | -- | -- |
Source: Public Records
Mortgage History
| Date | Status | Borrower | Loan Amount |
|---|---|---|---|
| Previous Owner | Olson Jordon C | $392,000 | |
| Previous Owner | Holloway Eugene E | $201,500 |
Source: Public Records
Tax History Compared to Growth
Tax History
| Year | Tax Paid | Tax Assessment Tax Assessment Total Assessment is a certain percentage of the fair market value that is determined by local assessors to be the total taxable value of land and additions on the property. | Land | Improvement |
|---|---|---|---|---|
| 2025 | $7,693 | $708,965 | $156,171 | $552,794 |
| 2023 | $7,693 | $681,436 | $150,107 | $531,329 |
| 2022 | $7,562 | $668,075 | $147,164 | $520,911 |
| 2021 | $7,649 | $654,977 | $144,279 | $510,698 |
| 2020 | $6,239 | $533,800 | $142,800 | $391,000 |
| 2019 | $5,750 | $490,000 | $140,000 | $350,000 |
| 2018 | $2,992 | $259,085 | $74,048 | $185,037 |
| 2017 | $2,936 | $254,006 | $72,597 | $181,409 |
| 2016 | $2,881 | $249,026 | $71,174 | $177,852 |
| 2014 | $2,579 | $220,482 | $68,732 | $151,750 |
Source: Public Records
Map
Nearby Homes