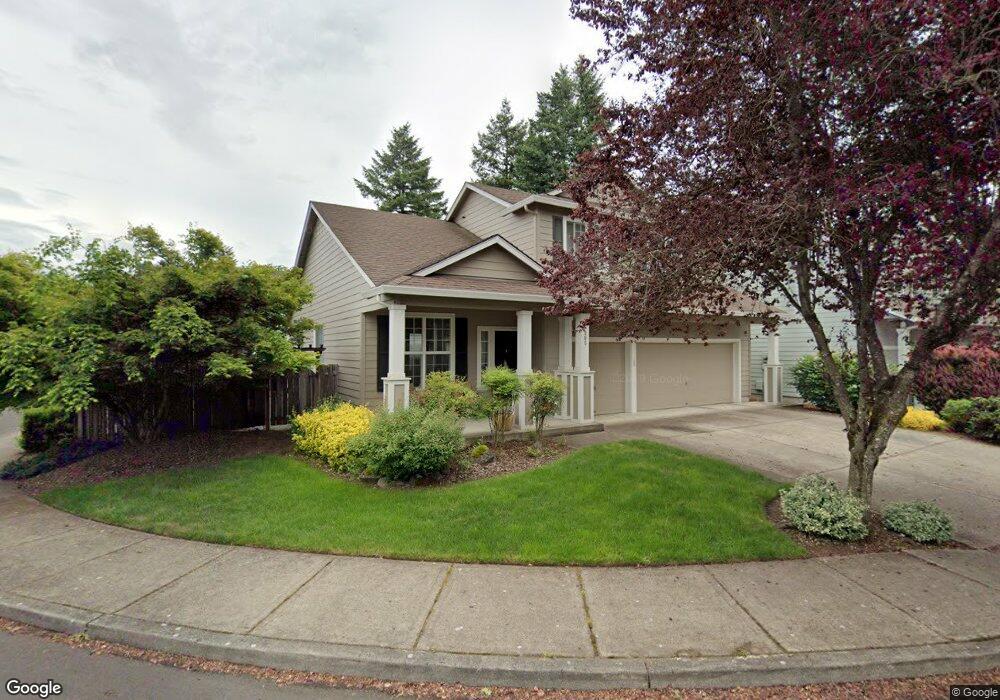
505 SE 197th Place Camas, WA 98607
Mill Plain NeighborhoodEstimated Value: $669,219 - $758,000
3
Beds
3
Baths
2,299
Sq Ft
$308/Sq Ft
Est. Value
About This Home
This home is located at 505 SE 197th Place, Camas, WA 98607 and is currently estimated at $708,805, approximately $308 per square foot. 505 SE 197th Place is a home located in Clark County with nearby schools including Illahee Elementary School, Shahala Middle School, and Union High School.
Ownership History
Date
Name
Owned For
Owner Type
Purchase Details
Closed on
Oct 9, 2013
Sold by
Gresham Richard and Yan Maggie
Bought by
Gresham Richard D and Yan Maggie
Current Estimated Value
Home Financials for this Owner
Home Financials are based on the most recent Mortgage that was taken out on this home.
Original Mortgage
$359,174
Outstanding Balance
$270,415
Interest Rate
4.55%
Mortgage Type
VA
Estimated Equity
$438,390
Purchase Details
Closed on
Feb 7, 2002
Sold by
Gresham Richard
Bought by
Gresham Richard and Yan Maggie
Home Financials for this Owner
Home Financials are based on the most recent Mortgage that was taken out on this home.
Original Mortgage
$200,500
Interest Rate
6.51%
Purchase Details
Closed on
Dec 19, 2001
Sold by
Schuler Homes Of Washington Inc
Bought by
Gresham Richard
Home Financials for this Owner
Home Financials are based on the most recent Mortgage that was taken out on this home.
Original Mortgage
$200,500
Interest Rate
6.51%
Create a Home Valuation Report for This Property
The Home Valuation Report is an in-depth analysis detailing your home's value as well as a comparison with similar homes in the area
Home Values in the Area
Average Home Value in this Area
Purchase History
| Date | Buyer | Sale Price | Title Company |
|---|---|---|---|
| Gresham Richard D | -- | Fidelity National Title | |
| Gresham Richard | -- | Fidelity National Title Co | |
| Gresham Richard | $211,094 | Fidelity National Title Co |
Source: Public Records
Mortgage History
| Date | Status | Borrower | Loan Amount |
|---|---|---|---|
| Open | Gresham Richard D | $359,174 | |
| Closed | Gresham Richard | $200,500 |
Source: Public Records
Tax History Compared to Growth
Tax History
| Year | Tax Paid | Tax Assessment Tax Assessment Total Assessment is a certain percentage of the fair market value that is determined by local assessors to be the total taxable value of land and additions on the property. | Land | Improvement |
|---|---|---|---|---|
| 2025 | $5,953 | $615,874 | $240,000 | $375,874 |
| 2024 | $6,118 | $600,305 | $240,000 | $360,305 |
| 2023 | $5,582 | $640,125 | $252,960 | $387,165 |
| 2022 | $5,007 | $576,972 | $210,800 | $366,172 |
| 2021 | $4,809 | $490,850 | $179,800 | $311,050 |
| 2020 | $4,408 | $445,487 | $162,750 | $282,737 |
| 2019 | $3,982 | $412,195 | $155,000 | $257,195 |
| 2018 | $4,976 | $400,968 | $0 | $0 |
| 2017 | $4,317 | $402,811 | $0 | $0 |
| 2016 | $4,503 | $361,850 | $0 | $0 |
| 2015 | $4,397 | $361,436 | $0 | $0 |
| 2014 | -- | $337,372 | $0 | $0 |
| 2013 | -- | $294,236 | $0 | $0 |
Source: Public Records
Map
Nearby Homes
- 19801 SE 6th Way
- 19612 SE 9th Cir
- 1006 SE 199th Ave
- 19508 SE 10th St
- 1112 SE 198th Ct
- Juniper Plan at Cascade Terrace
- Wallace Plan at Cascade Terrace
- Magnolia Plan at Cascade Terrace
- Cypress Plan at Cascade Terrace
- Jade Plan at Cascade Terrace
- 1112 SE 194th Place
- 1114 SE 194th Place
- 1109 SE 193rd Place
- 1111 SE 193rd Place
- 1113 SE 193rd Place
- 19313 SE 12th Way
- 19311 SE 12th Way
- 19309 SE 12th Way
- 19307 SE 12th Way
- 19311 SE 12th Way
- 509 SE 197th Place
- 19707 SE 5th Way
- 515 SE 197th Place
- 19711 SE 5th Way
- 508 SE 197th Place
- 504 SE 197th Place
- 19706 SE 6th Way
- 19708 SE 5th Way
- 19704 SE 5th Way
- 512 SE 197th Place
- 500 SE 197th Place
- 19702 SE 5th Way
- 19712 SE 5th Way
- 19710 SE 6th Way
- 19803 SE 5th Way
- 19800 SE 5th Way
- 516 SE 197th Place
- 19802 SE 6th Way
- 19701 SE 4th Way
- 19705 SE 4th Way