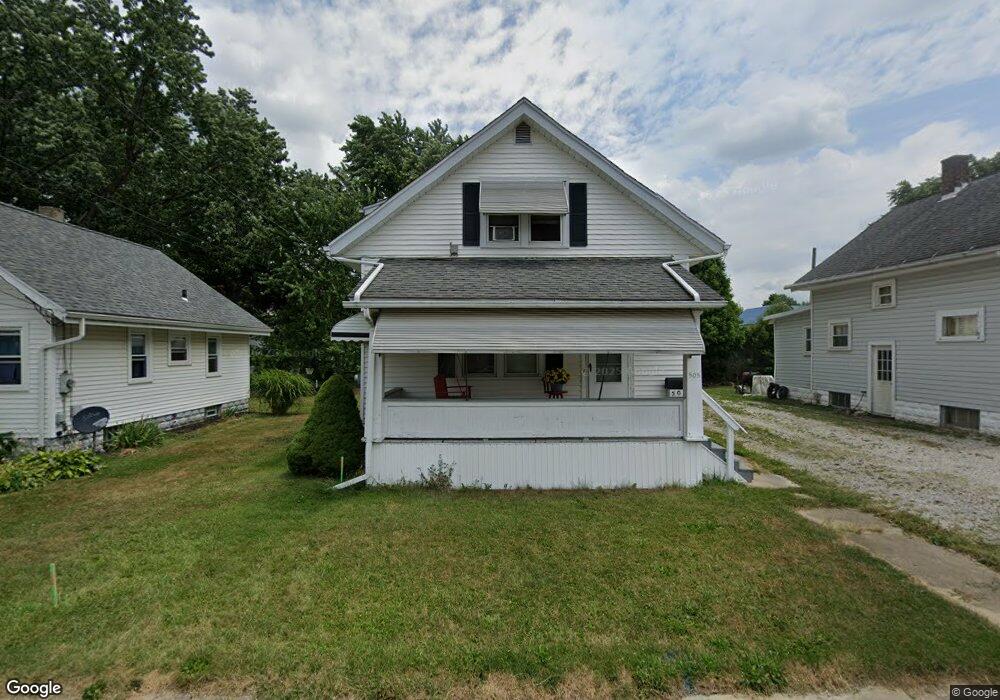
505 Snader Ave Ashland, OH 44805
Estimated Value: $102,663 - $123,000
2
Beds
1
Bath
1,027
Sq Ft
$110/Sq Ft
Est. Value
About This Home
This home is located at 505 Snader Ave, Ashland, OH 44805 and is currently estimated at $112,916, approximately $109 per square foot. 505 Snader Ave is a home located in Ashland County with nearby schools including Ashland High School, Ashland County Community Academy, and St. Edward Elementary School.
Ownership History
Date
Name
Owned For
Owner Type
Purchase Details
Closed on
Dec 17, 2024
Sold by
Adlou Llc and Adlou Ltd
Bought by
Akasha Rentals Llc
Current Estimated Value
Purchase Details
Closed on
Apr 25, 2011
Purchase Details
Closed on
Feb 28, 2011
Purchase Details
Closed on
Oct 26, 2010
Sold by
Marker Mark A
Purchase Details
Closed on
Sep 9, 2004
Bought by
Marker Mark A
Purchase Details
Closed on
Jul 13, 2004
Sold by
Younce Tony L
Purchase Details
Closed on
Dec 20, 1999
Sold by
Bihari Martha S
Bought by
Younce Tony L
Purchase Details
Closed on
Oct 11, 1988
Bought by
Bihari Martha S
Create a Home Valuation Report for This Property
The Home Valuation Report is an in-depth analysis detailing your home's value as well as a comparison with similar homes in the area
Home Values in the Area
Average Home Value in this Area
Purchase History
| Date | Buyer | Sale Price | Title Company |
|---|---|---|---|
| Akasha Rentals Llc | -- | Heartland Title | |
| Akasha Rentals Llc | -- | Heartland Title | |
| -- | -- | -- | |
| -- | $18,500 | -- | |
| -- | $30,000 | -- | |
| Marker Mark A | $52,000 | -- | |
| -- | $42,700 | -- | |
| Younce Tony L | $61,300 | -- | |
| Bihari Martha S | $29,000 | -- |
Source: Public Records
Tax History Compared to Growth
Tax History
| Year | Tax Paid | Tax Assessment Tax Assessment Total Assessment is a certain percentage of the fair market value that is determined by local assessors to be the total taxable value of land and additions on the property. | Land | Improvement |
|---|---|---|---|---|
| 2024 | $683 | $19,240 | $3,990 | $15,250 |
| 2023 | $683 | $19,240 | $3,990 | $15,250 |
| 2022 | $786 | $17,480 | $3,620 | $13,860 |
| 2021 | $789 | $17,480 | $3,620 | $13,860 |
| 2020 | $748 | $17,480 | $3,620 | $13,860 |
| 2019 | $721 | $15,580 | $3,570 | $12,010 |
| 2018 | $727 | $15,580 | $3,570 | $12,010 |
| 2017 | $712 | $15,580 | $3,570 | $12,010 |
| 2016 | $712 | $14,550 | $3,330 | $11,220 |
| 2015 | $706 | $14,550 | $3,330 | $11,220 |
| 2013 | $841 | $17,030 | $3,260 | $13,770 |
Source: Public Records
Map
Nearby Homes