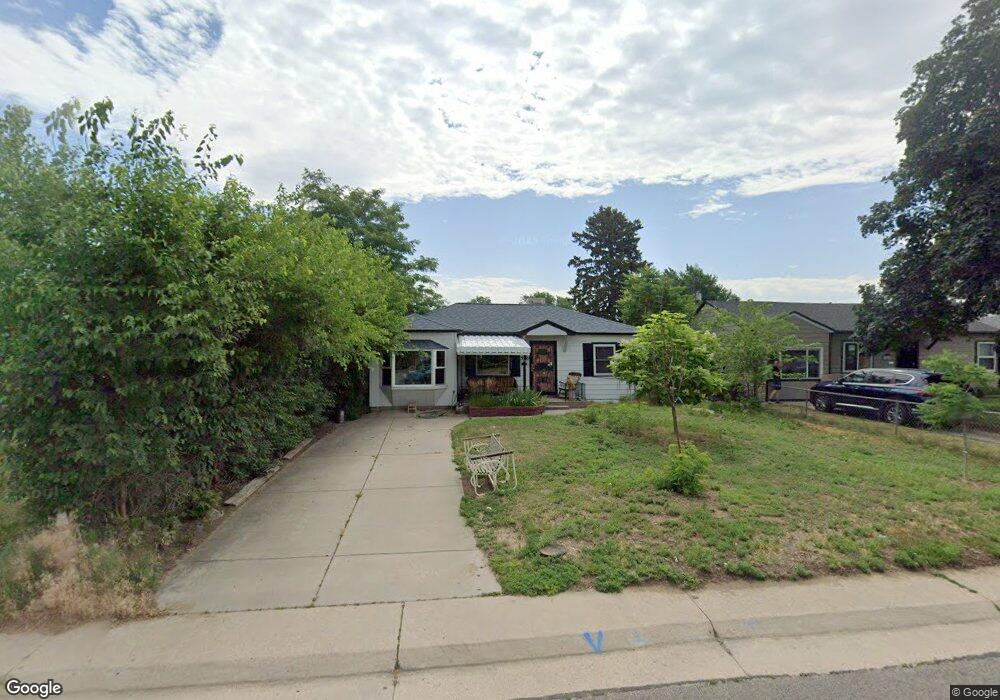
5050 Eliot St Denver, CO 80221
Chaffee Park NeighborhoodEstimated Value: $600,000 - $679,411
3
Beds
3
Baths
2,325
Sq Ft
$271/Sq Ft
Est. Value
About This Home
This home is located at 5050 Eliot St, Denver, CO 80221 and is currently estimated at $629,853, approximately $270 per square foot. 5050 Eliot St is a home located in Denver County with nearby schools including Beach Court Elementary School, Bryant Webster Dual Language School, and Skinner Middle School.
Ownership History
Date
Name
Owned For
Owner Type
Purchase Details
Closed on
Jun 9, 2016
Sold by
Ruff Paul G and Ruff Dunia B
Bought by
Weaver David B
Current Estimated Value
Home Financials for this Owner
Home Financials are based on the most recent Mortgage that was taken out on this home.
Original Mortgage
$185,100
Outstanding Balance
$147,319
Interest Rate
3.57%
Mortgage Type
New Conventional
Estimated Equity
$482,534
Purchase Details
Closed on
Nov 19, 2014
Sold by
Simonson Arnold J and Simonson Helen M
Bought by
Ruff Paul G and Ruff Dunia B
Home Financials for this Owner
Home Financials are based on the most recent Mortgage that was taken out on this home.
Original Mortgage
$247,500
Interest Rate
3.93%
Mortgage Type
New Conventional
Create a Home Valuation Report for This Property
The Home Valuation Report is an in-depth analysis detailing your home's value as well as a comparison with similar homes in the area
Home Values in the Area
Average Home Value in this Area
Purchase History
| Date | Buyer | Sale Price | Title Company |
|---|---|---|---|
| Weaver David B | $365,100 | First American | |
| Ruff Paul G | $275,000 | None Available |
Source: Public Records
Mortgage History
| Date | Status | Borrower | Loan Amount |
|---|---|---|---|
| Open | Weaver David B | $185,100 | |
| Previous Owner | Ruff Paul G | $247,500 |
Source: Public Records
Tax History Compared to Growth
Tax History
| Year | Tax Paid | Tax Assessment Tax Assessment Total Assessment is a certain percentage of the fair market value that is determined by local assessors to be the total taxable value of land and additions on the property. | Land | Improvement |
|---|---|---|---|---|
| 2024 | $3,329 | $42,030 | $13,060 | $28,970 |
| 2023 | $3,257 | $42,030 | $13,060 | $28,970 |
| 2022 | $2,728 | $34,300 | $13,020 | $21,280 |
| 2021 | $2,728 | $35,290 | $13,400 | $21,890 |
| 2020 | $2,303 | $31,040 | $13,400 | $17,640 |
| 2019 | $2,238 | $31,040 | $13,400 | $17,640 |
| 2018 | $2,114 | $27,320 | $6,750 | $20,570 |
| 2017 | $2,107 | $27,320 | $6,750 | $20,570 |
| 2016 | $1,474 | $18,070 | $2,985 | $15,085 |
| 2015 | $1,412 | $18,070 | $2,985 | $15,085 |
| 2014 | $602 | $14,500 | $3,041 | $11,459 |
Source: Public Records
Map
Nearby Homes
- 2851 W 52nd Ave Unit 404
- 4888 Elm Ct
- 2869 W Parkside Place
- 2835 W Parkside Place Unit 305
- 4933 Grove St
- 4869 Clay St
- 2876 W 53rd Ave Unit 111
- 2876 W 53rd Ave Unit 301
- 2876 W 53rd Ave Unit 106
- 4901 Bryant St
- 4901 Grove St
- 3011 W 53rd Ave
- 4775 Decatur St
- 2541 W 52nd Ave
- 4752 Eliot St
- 5185 Alcott St
- 5350 Primrose Ln
- 3047 W 47th Ave Unit 604
- 3047 W 47th Ave Unit 312
- 3047 W 47th Ave Unit 109