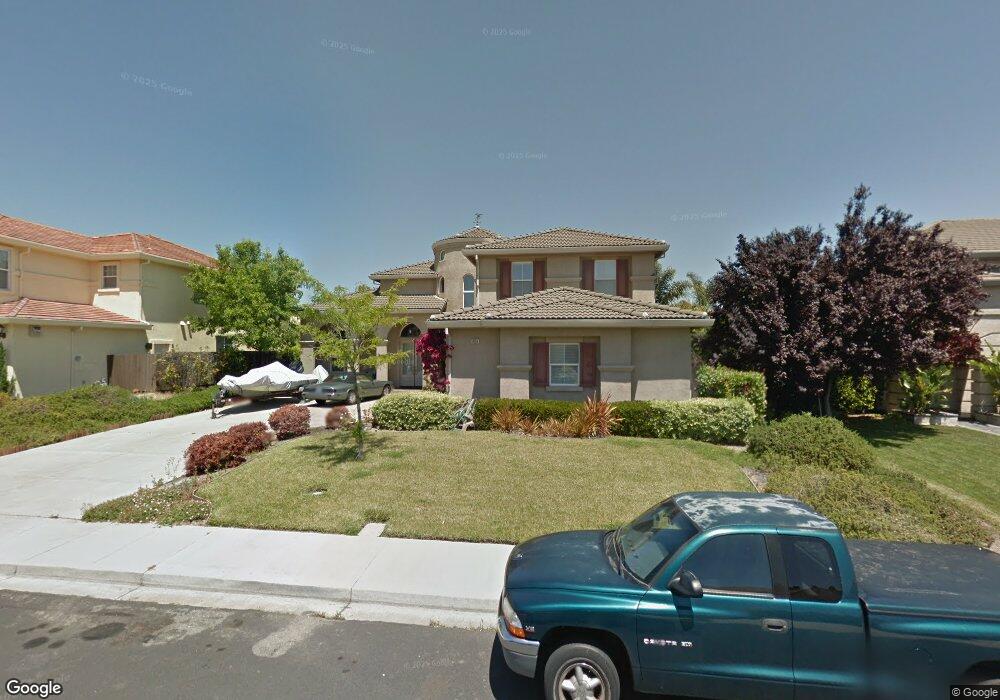
5050 Witherow Way Antioch, CA 94531
Lone Tree Valley NeighborhoodEstimated Value: $798,000 - $988,000
5
Beds
3
Baths
3,383
Sq Ft
$261/Sq Ft
Est. Value
About This Home
This home is located at 5050 Witherow Way, Antioch, CA 94531 and is currently estimated at $882,205, approximately $260 per square foot. 5050 Witherow Way is a home located in Contra Costa County with nearby schools including John Muir Elementary School, Dallas Ranch Middle School, and Deer Valley High School.
Ownership History
Date
Name
Owned For
Owner Type
Purchase Details
Closed on
Mar 3, 2011
Sold by
Castaneda Oscar and Castaneda Ana Maria
Bought by
Huang Wenfeng and Liu Qian
Current Estimated Value
Home Financials for this Owner
Home Financials are based on the most recent Mortgage that was taken out on this home.
Original Mortgage
$235,000
Outstanding Balance
$145,152
Interest Rate
2.75%
Mortgage Type
New Conventional
Estimated Equity
$737,053
Purchase Details
Closed on
Aug 3, 1999
Sold by
Black Diamond Knolls Limited
Bought by
Castaneda Oscar and Castaneda Ana Maria
Home Financials for this Owner
Home Financials are based on the most recent Mortgage that was taken out on this home.
Original Mortgage
$284,650
Interest Rate
7.7%
Mortgage Type
Purchase Money Mortgage
Create a Home Valuation Report for This Property
The Home Valuation Report is an in-depth analysis detailing your home's value as well as a comparison with similar homes in the area
Home Values in the Area
Average Home Value in this Area
Purchase History
| Date | Buyer | Sale Price | Title Company |
|---|---|---|---|
| Huang Wenfeng | $335,000 | North American Title Company | |
| Castaneda Oscar | $356,000 | Old Republic Title Company |
Source: Public Records
Mortgage History
| Date | Status | Borrower | Loan Amount |
|---|---|---|---|
| Open | Huang Wenfeng | $235,000 | |
| Previous Owner | Castaneda Oscar | $284,650 | |
| Closed | Castaneda Oscar | $35,500 |
Source: Public Records
Tax History
| Year | Tax Paid | Tax Assessment Tax Assessment Total Assessment is a certain percentage of the fair market value that is determined by local assessors to be the total taxable value of land and additions on the property. | Land | Improvement |
|---|---|---|---|---|
| 2025 | $5,220 | $429,183 | $64,052 | $365,131 |
| 2024 | $4,917 | $420,769 | $62,797 | $357,972 |
| 2023 | $4,917 | $412,519 | $61,566 | $350,953 |
| 2022 | $4,842 | $404,431 | $60,359 | $344,072 |
| 2021 | $4,700 | $396,502 | $59,176 | $337,326 |
| 2019 | $4,595 | $384,744 | $57,422 | $327,322 |
| 2018 | $4,424 | $377,201 | $56,297 | $320,904 |
| 2017 | $4,335 | $369,806 | $55,194 | $314,612 |
| 2016 | $4,232 | $362,556 | $54,112 | $308,444 |
| 2015 | $4,530 | $357,111 | $53,300 | $303,811 |
| 2014 | $4,675 | $350,116 | $52,256 | $297,860 |
Source: Public Records
Map
Nearby Homes
- 5004 Star Mine Way
- 5152 Cutler Ct
- 5065 Carbondale Way
- 5106 Watkings Way
- 4125 Rogers Canyon Rd
- 1157 Rockspring Way
- 5081 Mesa Ridge Dr
- 5230 Henderson Ct
- 5227 Ramsdell Ct
- 4737 Crestone Peak Ct
- 5388 Southwood Way
- 1246 Oak Haven Way
- 1505 Barkley Mountain Way
- 1256 Mokelumne Ct
- 4729 Matterhorn Ct
- 4101 S Royal Links Cir
- 4109 S Royal Links Cir
- 5448 Southwood Way
- 1879 Mount Conness Way
- 1821 Kern Mountain Way
- 5052 Witherow Way
- 5048 Witherow Way
- 5051 Webber Ct
- 5054 Witherow Way
- 5046 Witherow Way
- 5053 Webber Ct
- 5049 Witherow Way
- 5051 Witherow Way
- 5047 Witherow Way
- 5061 Union Mine Dr
- 5053 Witherow Way
- 5044 Witherow Way
- 5056 Boyle Way
- 5049 Webber Ct
- 5055 Webber Ct
- 5045 Witherow Way
- 5050 Nortonville Way
- 5065 Union Mine Dr
- 5058 Boyle Way
- 5054 Nortonville Way
Your Personal Tour Guide
Ask me questions while you tour the home.