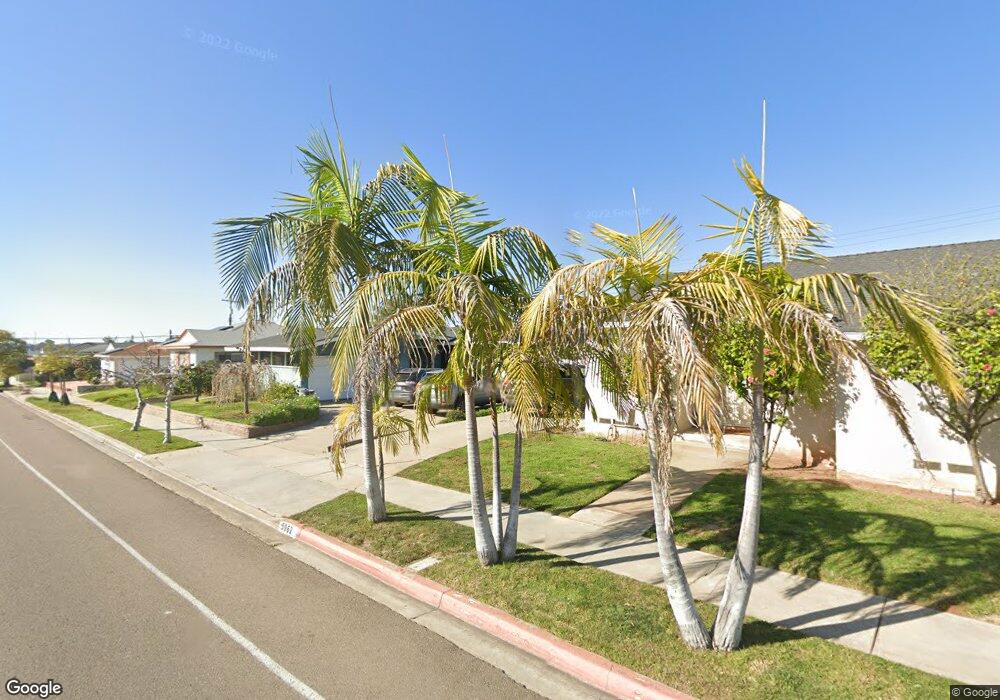
5050 Zion Ave San Diego, CA 92120
Allied Gardens NeighborhoodEstimated Value: $888,423 - $962,000
4
Beds
2
Baths
1,174
Sq Ft
$787/Sq Ft
Est. Value
About This Home
This home is located at 5050 Zion Ave, San Diego, CA 92120 and is currently estimated at $923,606, approximately $786 per square foot. 5050 Zion Ave is a home located in San Diego County with nearby schools including Foster Elementary School, Lewis Middle School, and Patrick Henry High School.
Ownership History
Date
Name
Owned For
Owner Type
Purchase Details
Closed on
May 21, 2012
Sold by
Constantini Anthony T
Bought by
Constantini Lisa
Current Estimated Value
Home Financials for this Owner
Home Financials are based on the most recent Mortgage that was taken out on this home.
Original Mortgage
$272,000
Outstanding Balance
$188,101
Interest Rate
3.86%
Mortgage Type
New Conventional
Estimated Equity
$735,505
Purchase Details
Closed on
Oct 25, 2001
Sold by
Smith Jeffrey Graham and Smith Rachel Renee
Bought by
Constantini Anthony T and Constantini Lisa
Home Financials for this Owner
Home Financials are based on the most recent Mortgage that was taken out on this home.
Original Mortgage
$206,400
Interest Rate
6.62%
Purchase Details
Closed on
Dec 18, 1998
Sold by
Nick Dehamer and Shari Duran
Bought by
Smith Jeffrey Graham and Smith Rachel Renee
Home Financials for this Owner
Home Financials are based on the most recent Mortgage that was taken out on this home.
Original Mortgage
$179,520
Interest Rate
6.63%
Mortgage Type
VA
Create a Home Valuation Report for This Property
The Home Valuation Report is an in-depth analysis detailing your home's value as well as a comparison with similar homes in the area
Home Values in the Area
Average Home Value in this Area
Purchase History
| Date | Buyer | Sale Price | Title Company |
|---|---|---|---|
| Constantini Lisa | -- | Act Title | |
| Constantini Anthony T | $258,000 | First American Title Ins Co | |
| Smith Jeffrey Graham | $176,000 | Chicago Title Co |
Source: Public Records
Mortgage History
| Date | Status | Borrower | Loan Amount |
|---|---|---|---|
| Open | Constantini Lisa | $272,000 | |
| Closed | Constantini Anthony T | $206,400 | |
| Previous Owner | Smith Jeffrey Graham | $179,520 | |
| Closed | Constantini Anthony T | $25,800 |
Source: Public Records
Tax History Compared to Growth
Tax History
| Year | Tax Paid | Tax Assessment Tax Assessment Total Assessment is a certain percentage of the fair market value that is determined by local assessors to be the total taxable value of land and additions on the property. | Land | Improvement |
|---|---|---|---|---|
| 2025 | $6,953 | $381,117 | $238,202 | $142,915 |
| 2024 | $6,953 | $373,645 | $233,532 | $140,113 |
| 2023 | $6,851 | $366,319 | $228,953 | $137,366 |
| 2022 | $6,731 | $359,137 | $224,464 | $134,673 |
| 2021 | $6,701 | $352,096 | $220,063 | $132,033 |
| 2020 | $6,517 | $348,487 | $217,807 | $130,680 |
| 2019 | $6,440 | $341,655 | $213,537 | $128,118 |
| 2018 | $6,164 | $334,956 | $209,350 | $125,606 |
| 2017 | $6,050 | $328,390 | $205,246 | $123,144 |
| 2016 | $5,988 | $321,952 | $201,222 | $120,730 |
| 2015 | $5,942 | $317,117 | $198,200 | $118,917 |
| 2014 | $3,613 | $310,906 | $194,318 | $116,588 |
Source: Public Records
Map
Nearby Homes
- 6549 Glenroy St
- 6543 Carthage St
- 6391 Estrella Ave
- 6642 Eldridge St
- 6820 Newberry St
- 6817 Birchwood St
- 6818 Carthage St
- 5125 Fontaine St Unit 105
- 7137 Keighley St
- 4912.5 Old Cliffs Rd
- 4944 Old Cliffs Rd
- 4778 1/2 Old Cliffs Rd
- 4808 1/2 Old Cliffs Rd
- 4982 Old Cliffs Rd
- 6725 Mission Gorge Rd Unit 104B
- 6182 Loukelton Cir
- 5468 Princess View Place
- 6234 Crawford St
- 6994 Carthage St
- 6675 Mission Gorge Rd Unit A114
- 5062 Zion Ave
- 5038 Zion Ave
- 5051 Rodman Ave
- 5063 Rodman Ave
- 5039 Rodman Ave
- 5074 Zion Ave
- 5026 Zion Ave
- 5075 Rodman Ave
- 5014 Zion Ave
- 5015 Rodman Ave
- 5002 Zion Ave
- 5052 Rodman Ave
- 5040 Rodman Ave
- 5064 Rodman Ave
- 5003 Rodman Ave
- 5028 Rodman Ave
- 5076 Rodman Ave
- 4974 Zion Ave
- 5016 Rodman Ave
- 4975 Rodman Ave