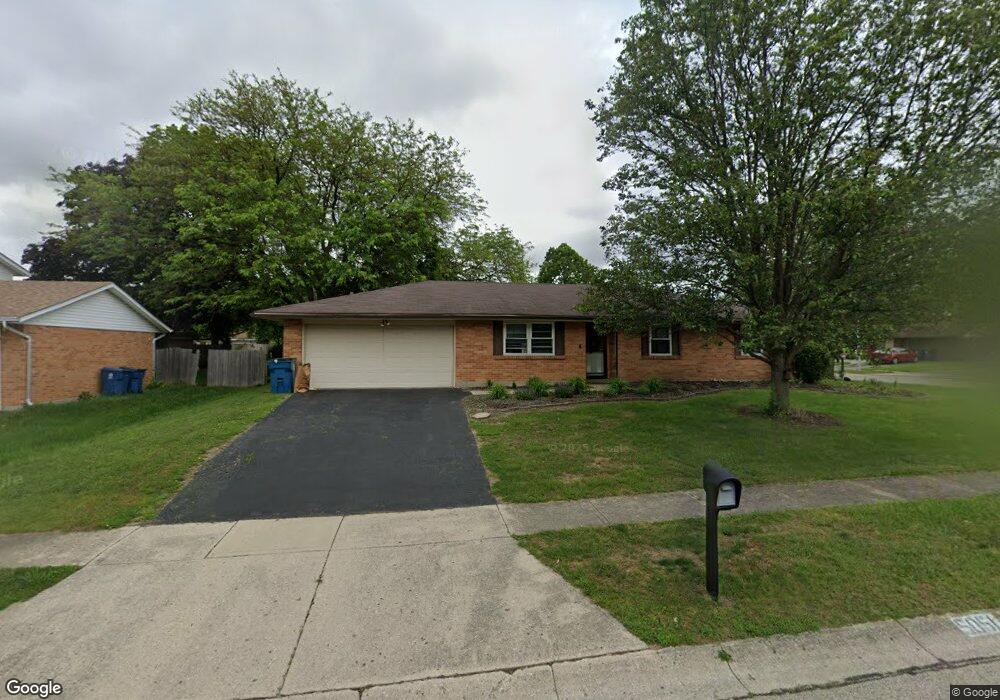
5051 Bluffview Dr Dayton, OH 45424
Estimated Value: $206,000 - $228,000
3
Beds
2
Baths
1,244
Sq Ft
$172/Sq Ft
Est. Value
About This Home
This home is located at 5051 Bluffview Dr, Dayton, OH 45424 and is currently estimated at $214,153, approximately $172 per square foot. 5051 Bluffview Dr is a home located in Montgomery County with nearby schools including Wayne High School and Huber Heights Christian Academy.
Ownership History
Date
Name
Owned For
Owner Type
Purchase Details
Closed on
Mar 30, 2007
Sold by
Walton Brian C and Walton Amy C
Bought by
Morales Alonso Lozano and Balderrama Sandra Felix
Current Estimated Value
Home Financials for this Owner
Home Financials are based on the most recent Mortgage that was taken out on this home.
Original Mortgage
$104,000
Outstanding Balance
$63,054
Interest Rate
6.2%
Mortgage Type
Purchase Money Mortgage
Estimated Equity
$151,099
Purchase Details
Closed on
Aug 14, 2003
Sold by
Todd Emery R and Hastler Heather R
Bought by
Walton Brian C
Home Financials for this Owner
Home Financials are based on the most recent Mortgage that was taken out on this home.
Original Mortgage
$112,324
Interest Rate
5.47%
Mortgage Type
VA
Purchase Details
Closed on
Apr 5, 2000
Sold by
Elaine Castle and Elaine R
Bought by
Emery R Todd and Hastler Heather R
Home Financials for this Owner
Home Financials are based on the most recent Mortgage that was taken out on this home.
Original Mortgage
$71,000
Interest Rate
8.31%
Create a Home Valuation Report for This Property
The Home Valuation Report is an in-depth analysis detailing your home's value as well as a comparison with similar homes in the area
Home Values in the Area
Average Home Value in this Area
Purchase History
| Date | Buyer | Sale Price | Title Company |
|---|---|---|---|
| Morales Alonso Lozano | $130,000 | Attorney | |
| Walton Brian C | $104,400 | -- | |
| Emery R Todd | $88,900 | Safemax Title Agency Inc |
Source: Public Records
Mortgage History
| Date | Status | Borrower | Loan Amount |
|---|---|---|---|
| Open | Morales Alonso Lozano | $104,000 | |
| Closed | Walton Brian C | $112,324 | |
| Previous Owner | Emery R Todd | $71,000 |
Source: Public Records
Tax History Compared to Growth
Tax History
| Year | Tax Paid | Tax Assessment Tax Assessment Total Assessment is a certain percentage of the fair market value that is determined by local assessors to be the total taxable value of land and additions on the property. | Land | Improvement |
|---|---|---|---|---|
| 2024 | $2,885 | $54,420 | $12,340 | $42,080 |
| 2023 | $2,885 | $54,420 | $12,340 | $42,080 |
| 2022 | $2,591 | $38,620 | $8,750 | $29,870 |
| 2021 | $2,763 | $38,620 | $8,750 | $29,870 |
| 2020 | $2,765 | $38,620 | $8,750 | $29,870 |
| 2019 | $2,554 | $31,360 | $8,750 | $22,610 |
| 2018 | $2,562 | $31,360 | $8,750 | $22,610 |
| 2017 | $2,548 | $31,360 | $8,750 | $22,610 |
| 2016 | $2,312 | $30,010 | $8,750 | $21,260 |
| 2015 | $2,283 | $30,010 | $8,750 | $21,260 |
| 2014 | $2,283 | $30,010 | $8,750 | $21,260 |
| 2012 | -- | $27,480 | $8,750 | $18,730 |
Source: Public Records
Map
Nearby Homes
- 5580 Clagston Ct
- 5582 Camerford Dr
- 4931 Longford Rd
- 5873 Troy Villa Blvd Unit 20174
- 7077 Sandalview Dr
- 5631 Longford Rd
- 4834 Lodgeview Dr
- 6724 Willow Creek Dr
- 6851 Locustview Dr
- 6686 Oakwood Ln
- 5637 Troy Villa Blvd Unit 20088
- 6805 Willow Creek Dr
- 6828 Willow Creek Dr
- 5907 Beech Ct
- 6514 Wrenview Ct
- 6936 Willow Tree Ln
- 7500 Mount Ranier Unit 12077
- 4731 Deerwood Ct
- 6150 Taylorsville Rd
- 5904 Troy Villa Blvd Unit 20051
- 5041 Bluffview Dr
- 7311 Huntsview Ct
- 5031 Bluffview Dr
- 7300 Huntsview Ct
- 5050 Bluffview Dr
- 7321 Huntsview Ct
- 7310 Huntsview Ct
- 5100 Bluffview Dr
- 5040 Bluffview Dr
- 5081 Ashview Ct
- 7320 Huntsview Ct
- 5110 Bluffview Dr
- 5030 Bluffview Dr
- 5021 Bluffview Dr
- 7331 Huntsview Ct
- 7330 Huntsview Ct
- 5082 Ashview Ct
- 5120 Bluffview Dr
- 7309 Kirkview Dr
- 5051 Bellview Ct