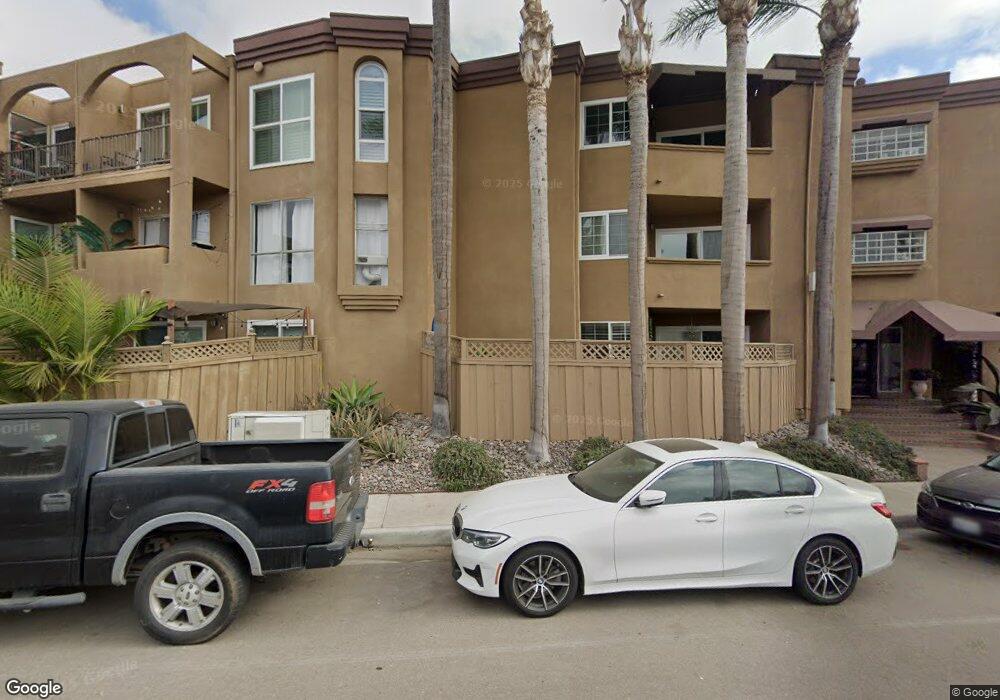
5051 La Jolla Blvd Unit 213 San Diego, CA 92109
Pacific Beach NeighborhoodEstimated Value: $600,000 - $677,096
1
Bed
1
Bath
625
Sq Ft
$1,027/Sq Ft
Est. Value
About This Home
This home is located at 5051 La Jolla Blvd Unit 213, San Diego, CA 92109 and is currently estimated at $642,024, approximately $1,027 per square foot. 5051 La Jolla Blvd Unit 213 is a home located in San Diego County with nearby schools including Bird Rock Elementary School, Muirlands Middle School, and La Jolla High School.
Ownership History
Date
Name
Owned For
Owner Type
Purchase Details
Closed on
May 13, 2021
Sold by
Gross Aaron Saul and Gross Aaron S
Bought by
Gross Aaron Saul and Channin Jennifer
Current Estimated Value
Home Financials for this Owner
Home Financials are based on the most recent Mortgage that was taken out on this home.
Original Mortgage
$385,000
Outstanding Balance
$346,690
Interest Rate
2.7%
Mortgage Type
New Conventional
Estimated Equity
$295,334
Purchase Details
Closed on
Oct 8, 2014
Sold by
Hyvonen Adeienne C
Bought by
Gross Aaron S
Home Financials for this Owner
Home Financials are based on the most recent Mortgage that was taken out on this home.
Original Mortgage
$75,200
Interest Rate
4.2%
Mortgage Type
Stand Alone Second
Purchase Details
Closed on
Oct 24, 2013
Sold by
Bame William A
Bought by
Bame William A
Purchase Details
Closed on
Nov 20, 1995
Sold by
Reed Monte
Bought by
Gong David R
Purchase Details
Closed on
Jan 12, 1995
Sold by
Gong David R
Bought by
Reed Monte
Purchase Details
Closed on
Dec 24, 1986
Purchase Details
Closed on
Feb 23, 1983
Create a Home Valuation Report for This Property
The Home Valuation Report is an in-depth analysis detailing your home's value as well as a comparison with similar homes in the area
Home Values in the Area
Average Home Value in this Area
Purchase History
| Date | Buyer | Sale Price | Title Company |
|---|---|---|---|
| Gross Aaron Saul | -- | Fidelity National Title Co | |
| Gross Aaron S | $298,500 | Ticor Title | |
| Bame William A | -- | None Available | |
| Gong David R | -- | First American Title | |
| Reed Monte | $36,000 | -- | |
| -- | $59,000 | -- | |
| -- | $64,300 | -- |
Source: Public Records
Mortgage History
| Date | Status | Borrower | Loan Amount |
|---|---|---|---|
| Open | Gross Aaron Saul | $385,000 | |
| Closed | Gross Aaron S | $75,200 | |
| Closed | Gross Aaron S | $208,375 |
Source: Public Records
Tax History Compared to Growth
Tax History
| Year | Tax Paid | Tax Assessment Tax Assessment Total Assessment is a certain percentage of the fair market value that is determined by local assessors to be the total taxable value of land and additions on the property. | Land | Improvement |
|---|---|---|---|---|
| 2025 | $4,351 | $358,741 | $300,457 | $58,284 |
| 2024 | $4,351 | $351,708 | $294,566 | $57,142 |
| 2023 | $4,255 | $344,813 | $288,791 | $56,022 |
| 2022 | $4,142 | $338,053 | $283,129 | $54,924 |
| 2021 | $4,028 | $331,426 | $277,578 | $53,848 |
| 2020 | $3,978 | $328,028 | $274,732 | $53,296 |
| 2019 | $3,906 | $321,597 | $269,346 | $52,251 |
| 2018 | $3,651 | $315,292 | $264,065 | $51,227 |
| 2017 | $3,563 | $309,111 | $258,888 | $50,223 |
| 2016 | $3,505 | $303,051 | $253,812 | $49,239 |
| 2015 | $3,452 | $298,500 | $250,000 | $48,500 |
| 2014 | $1,418 | $117,886 | $70,463 | $47,423 |
Source: Public Records
Map
Nearby Homes
- 727 Sapphire St Unit 301
- 751-63 Turquoise St Unit 27-30
- 972 Sapphire St Unit LA1
- 976 Sapphire St Unit LA3
- 4944 Cass St Unit 1003
- 4944 Cass St Unit 409
- 4944 Cass St Unit 407
- 819 Van Nuys St
- 4975 Dawes St
- 4767 Ocean Blvd
- 4767 Ocean Blvd Unit 411
- 1154 Sapphire St
- 5357 La Jolla Blvd Unit 29
- 623 Colima St
- 1148 Turquoise St
- 5341 Linda Way
- 1040 Van Nuys St
- 5416 Candlelight Dr
- 707 Diamond St Unit U1
- 4667 Ocean Blvd Unit 106
- 5051 La Jolla Blvd Unit 5051- La Jolla Blvd.
- 5051 La Jolla Blvd
- 5051 La Jolla Blvd Unit 307
- 5051 La Jolla Blvd Unit 302
- 5051 La Jolla Blvd Unit 300
- 5051 La Jolla Blvd Unit 209
- 5051 La Jolla Blvd Unit 201
- 5051 La Jolla Blvd Unit 200
- 5051 La Jolla Blvd Unit 208
- 5051 La Jolla Blvd Unit 210
- 5051 La Jolla Blvd Unit 211
- 5051 La Jolla Blvd Unit 207
- 5051 La Jolla Blvd Unit 205
- 5051 La Jolla Blvd Unit 203
- 5051 La Jolla Blvd Unit 202
- 5051 La Jolla Blvd Unit 212
- 5051 La Jolla Blvd Unit 112
- 5051 La Jolla Blvd Unit 110
- 5051 La Jolla Blvd Unit 108
- 5051 La Jolla Blvd Unit 104