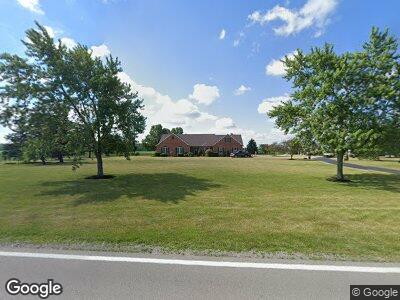
5051 State Route 120 Metamora, OH 43540
Estimated Value: $432,000 - $567,623
3
Beds
3
Baths
2,731
Sq Ft
$187/Sq Ft
Est. Value
About This Home
This home is located at 5051 State Route 120, Metamora, OH 43540 and is currently estimated at $510,874, approximately $187 per square foot. 5051 State Route 120 is a home with nearby schools including Evergreen Elementary School, Evergreen Middle School, and Evergreen High School.
Ownership History
Date
Name
Owned For
Owner Type
Purchase Details
Closed on
Apr 18, 2017
Sold by
Babcock Erik E and Babcock Candee K
Bought by
Babcock Erik E and Erik E Babcock Trust
Current Estimated Value
Purchase Details
Closed on
Aug 18, 2014
Sold by
Vandenbusche Norman J and Vandenbusche Patricia A
Bought by
The Norman J Vandenbusche & Patricia A V and Vandenbusche Patricia A
Home Financials for this Owner
Home Financials are based on the most recent Mortgage that was taken out on this home.
Original Mortgage
$180,000
Outstanding Balance
$140,164
Interest Rate
4.14%
Mortgage Type
Purchase Money Mortgage
Estimated Equity
$369,244
Purchase Details
Closed on
Aug 5, 2011
Sold by
Vandenbusche Patricia A
Bought by
Vandenbusche Norman J and Vandenbusche Patricia A
Purchase Details
Closed on
Jan 1, 1990
Bought by
Vandenbusche Norman
Create a Home Valuation Report for This Property
The Home Valuation Report is an in-depth analysis detailing your home's value as well as a comparison with similar homes in the area
Home Values in the Area
Average Home Value in this Area
Purchase History
| Date | Buyer | Sale Price | Title Company |
|---|---|---|---|
| Babcock Erik E | -- | Attorney | |
| The Norman J Vandenbusche & Patricia A V | -- | Port Lawrence Title & Trust | |
| Babcock Erik E | $365,000 | Port Lawrence Title & Trust | |
| Vandenbusche Norman J | -- | Attorney | |
| Vandenbusche Norman | -- | -- |
Source: Public Records
Mortgage History
| Date | Status | Borrower | Loan Amount |
|---|---|---|---|
| Open | Babcok Erik E | $50,000 | |
| Open | Babcock Erik E | $180,000 |
Source: Public Records
Tax History Compared to Growth
Tax History
| Year | Tax Paid | Tax Assessment Tax Assessment Total Assessment is a certain percentage of the fair market value that is determined by local assessors to be the total taxable value of land and additions on the property. | Land | Improvement |
|---|---|---|---|---|
| 2024 | $6,539 | $177,210 | $19,180 | $158,030 |
| 2023 | $6,539 | $177,210 | $19,180 | $158,030 |
| 2022 | $6,225 | $137,560 | $16,000 | $121,560 |
| 2021 | $6,097 | $137,560 | $16,000 | $121,560 |
| 2020 | $6,033 | $137,560 | $16,000 | $121,560 |
| 2019 | $5,729 | $133,290 | $13,550 | $119,740 |
| 2018 | $5,506 | $133,290 | $13,550 | $119,740 |
| 2017 | $5,375 | $133,290 | $13,550 | $119,740 |
| 2016 | $5,135 | $123,310 | $13,550 | $109,760 |
| 2015 | $5,131 | $123,310 | $13,550 | $109,760 |
| 2014 | $4,086 | $116,000 | $13,550 | $102,450 |
| 2013 | $3,437 | $95,870 | $14,700 | $81,170 |
Source: Public Records
Map
Nearby Homes
- 412 E Main St
- 13707 Brint Rd
- 10000 Blk E Weston Rd
- 1496 W Mulberry Rd
- 316 E Morenci St
- 306 Lincoln St
- 13001 Central Ave
- 12356 Sylvania Metamora Rd
- 3380 W Yankee Rd
- 1312 Ogden St
- 3844 Washburn Rd
- 3677 County Road J
- 556 S Lathrop Rd
- 10778 Sand Creek Hwy
- 10820 Brint Rd
- 1247 Seneca St
- 1083 Seneca St
- 1116 Seneca St
- 1110 Church St
- 4068 Gordon St