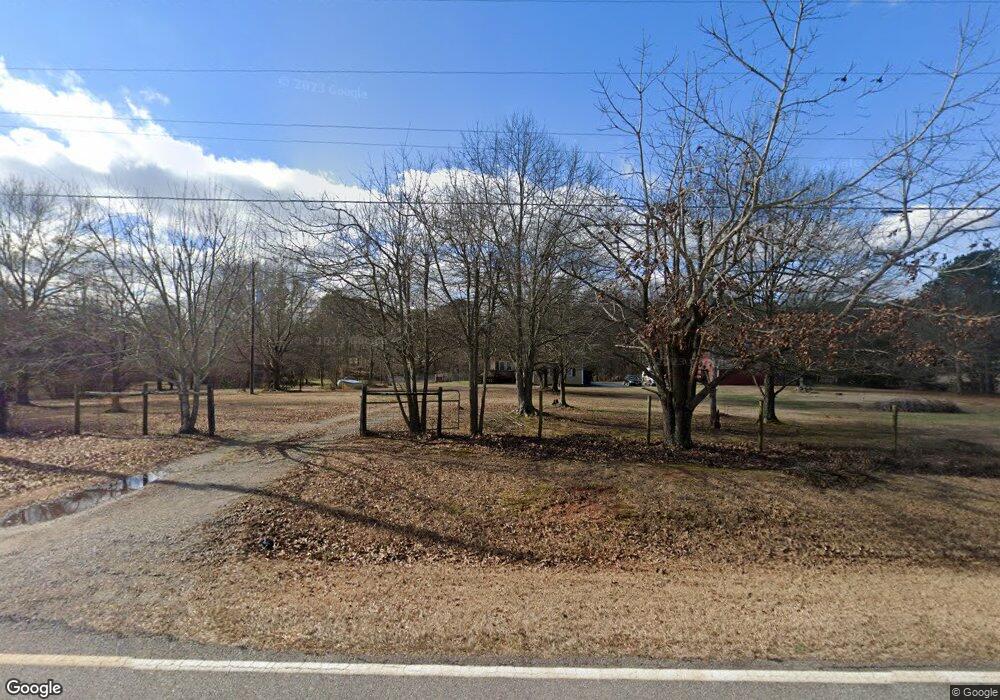
5051 Whitney Rd Social Circle, GA 30025
Estimated Value: $451,000 - $558,000
4
Beds
2
Baths
1,738
Sq Ft
$279/Sq Ft
Est. Value
About This Home
This home is located at 5051 Whitney Rd, Social Circle, GA 30025 and is currently estimated at $485,097, approximately $279 per square foot. 5051 Whitney Rd is a home located in Walton County with nearby schools including Harmony Elementary School, Carver Middle School, and Monroe Area High School.
Ownership History
Date
Name
Owned For
Owner Type
Purchase Details
Closed on
Jun 10, 2011
Sold by
Federal Natl Mtg Assn Fnma
Bought by
Williams Louisa J
Current Estimated Value
Home Financials for this Owner
Home Financials are based on the most recent Mortgage that was taken out on this home.
Original Mortgage
$135,475
Outstanding Balance
$93,918
Interest Rate
4.75%
Mortgage Type
FHA
Estimated Equity
$391,179
Purchase Details
Closed on
Oct 5, 2010
Sold by
Wells Fargo Bk Na
Bought by
Federal Natl Mtg Assn Fnma
Purchase Details
Closed on
Nov 20, 1998
Sold by
Schwier Schwier T and Schwier Deborah L
Bought by
Schwier Theodore and Schwier Deborah
Home Financials for this Owner
Home Financials are based on the most recent Mortgage that was taken out on this home.
Original Mortgage
$130,200
Interest Rate
6.47%
Mortgage Type
New Conventional
Purchase Details
Closed on
Nov 5, 1996
Sold by
Black Tony Rhonda
Bought by
L R Entpr Inc
Create a Home Valuation Report for This Property
The Home Valuation Report is an in-depth analysis detailing your home's value as well as a comparison with similar homes in the area
Home Values in the Area
Average Home Value in this Area
Purchase History
| Date | Buyer | Sale Price | Title Company |
|---|---|---|---|
| Williams Louisa J | -- | -- | |
| Federal Natl Mtg Assn Fnma | -- | -- | |
| Wells Fargo Bk Na | $193,672 | -- | |
| Schwier Theodore | -- | -- | |
| L R Entpr Inc | $19,500 | -- |
Source: Public Records
Mortgage History
| Date | Status | Borrower | Loan Amount |
|---|---|---|---|
| Open | Williams Louisa J | $135,475 | |
| Previous Owner | Schwier Theodore | $130,200 |
Source: Public Records
Tax History Compared to Growth
Tax History
| Year | Tax Paid | Tax Assessment Tax Assessment Total Assessment is a certain percentage of the fair market value that is determined by local assessors to be the total taxable value of land and additions on the property. | Land | Improvement |
|---|---|---|---|---|
| 2024 | $777 | $142,560 | $50,160 | $92,400 |
| 2023 | $594 | $130,800 | $47,600 | $83,200 |
| 2022 | $630 | $113,840 | $39,040 | $74,800 |
| 2021 | $569 | $100,920 | $33,360 | $67,560 |
| 2020 | $582 | $95,120 | $28,960 | $66,160 |
| 2019 | $662 | $80,480 | $23,400 | $57,080 |
| 2018 | $603 | $80,480 | $23,400 | $57,080 |
| 2017 | $2,528 | $73,360 | $23,400 | $49,960 |
| 2016 | $574 | $63,320 | $18,240 | $45,080 |
| 2015 | $574 | $58,960 | $18,240 | $40,720 |
| 2014 | $593 | $52,280 | $0 | $0 |
Source: Public Records
Map
Nearby Homes
- 2590 Walton Downs Rd
- 2590 Walton Downs Rd Unit 3
- 764 Social Circle Fairplay Rd
- 2560 Whitney Rd SE
- 1526 N Cherokee Rd
- 0 Pannell Rd Unit 10571545
- 0 Browning Shoals Rd Unit 7392331
- 0 Browning Shoals Rd Unit TRACT 1A & 1B
- 2433 Waterside Dr
- 2412 Waterside Dr
- 25 Browning Shoals Rd
- 511 Alcovy Lakes Dr
- 0 Barton Bridge Rd Unit LOT 1 10441983
- 1302 N Cherokee Rd
- 709 White Oak Trail
- 569 Highway 11 SW
- 1119 Heights View Way
- 1310 Knox Chapel Rd
- 684 N Cherokee Rd
- 176 Social Circle Fairplay Rd
- 1301 Lipscomb Rd
- 0 Lipscomb Rd Unit 3086661
- 0 Lipscomb Rd Unit 3086642
- 0 Lipscomb Rd Unit 7104234
- 0 Lipscomb Rd Unit 7104198
- 0 Lipscomb Rd Unit 7104216
- 0 Lipscomb Rd Unit 7173697
- 0 Lipscomb Rd Unit TR 4 7214657
- 0 Lipscomb Rd Unit 7268919
- 0 Lipscomb Rd Unit 4 7420154
- 0 Lipscomb Rd Unit 6 7420164
- 0 Lipscomb Rd Unit 3732647
- 0 Lipscomb Rd Unit 5153228
- 000 Lipscomb Rd
- 00 Lipscomb Rd
- 0 Lipscomb Rd Unit TRACK B 9031564
- 5031 Whitney Rd Unit 1
- 5060 Whitney Rd
- 5040 Whitney Rd
- 1321 Lipscomb Rd