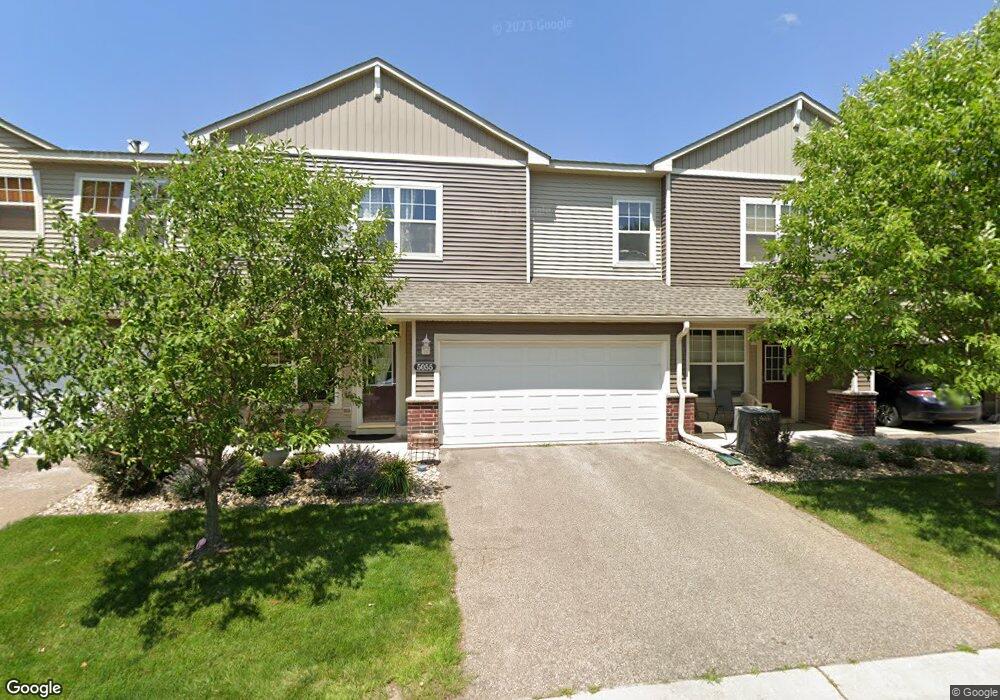
5055 Cherrybark Ln SE Unit 207 Rochester, MN 55904
Estimated Value: $253,000 - $273,000
2
Beds
2
Baths
1,531
Sq Ft
$172/Sq Ft
Est. Value
About This Home
This home is located at 5055 Cherrybark Ln SE Unit 207, Rochester, MN 55904 and is currently estimated at $262,662, approximately $171 per square foot. 5055 Cherrybark Ln SE Unit 207 is a home located in Olmsted County with nearby schools including Bamber Valley Elementary School, Willow Creek Middle School, and Mayo Senior High School.
Ownership History
Date
Name
Owned For
Owner Type
Purchase Details
Closed on
Oct 9, 2017
Sold by
Lamon Richard A and Lamon Cheryl A
Bought by
Lamon Colleen
Current Estimated Value
Purchase Details
Closed on
Mar 30, 2015
Sold by
May Adam M and May Lauren E
Bought by
Lamon Richard A and Lamon Cheryl A
Purchase Details
Closed on
May 18, 2012
Sold by
Rynerson Nadine L and Rynerson Ronald S
Bought by
May Adam M and May Lauren E
Home Financials for this Owner
Home Financials are based on the most recent Mortgage that was taken out on this home.
Original Mortgage
$122,072
Interest Rate
3.75%
Mortgage Type
FHA
Purchase Details
Closed on
Jan 29, 2007
Sold by
Centex Homes
Bought by
Perkins Nadine L
Home Financials for this Owner
Home Financials are based on the most recent Mortgage that was taken out on this home.
Original Mortgage
$136,979
Interest Rate
6.22%
Mortgage Type
New Conventional
Create a Home Valuation Report for This Property
The Home Valuation Report is an in-depth analysis detailing your home's value as well as a comparison with similar homes in the area
Home Values in the Area
Average Home Value in this Area
Purchase History
| Date | Buyer | Sale Price | Title Company |
|---|---|---|---|
| Lamon Colleen | $13,000 | None Available | |
| Lamon Richard A | $130,000 | None Available | |
| May Adam M | $126,500 | Multiple | |
| Perkins Nadine L | $136,978 | None Available |
Source: Public Records
Mortgage History
| Date | Status | Borrower | Loan Amount |
|---|---|---|---|
| Previous Owner | May Adam M | $122,072 | |
| Previous Owner | Perkins Nadine L | $136,979 |
Source: Public Records
Tax History Compared to Growth
Tax History
| Year | Tax Paid | Tax Assessment Tax Assessment Total Assessment is a certain percentage of the fair market value that is determined by local assessors to be the total taxable value of land and additions on the property. | Land | Improvement |
|---|---|---|---|---|
| 2024 | $2,546 | $228,900 | $45,000 | $183,900 |
| 2023 | $2,404 | $230,600 | $37,500 | $193,100 |
| 2022 | $1,940 | $202,000 | $37,500 | $164,500 |
| 2021 | $2,032 | $186,200 | $37,500 | $148,700 |
| 2020 | $2,022 | $166,500 | $35,000 | $131,500 |
| 2019 | $1,880 | $160,300 | $30,000 | $130,300 |
| 2018 | $1,667 | $151,500 | $20,000 | $131,500 |
| 2017 | $1,614 | $140,400 | $11,000 | $129,400 |
| 2016 | $1,588 | $106,500 | $8,900 | $97,600 |
| 2015 | $1,478 | $102,700 | $8,800 | $93,900 |
| 2014 | $1,430 | $102,700 | $8,800 | $93,900 |
| 2012 | -- | $101,400 | $8,769 | $92,631 |
Source: Public Records
Map
Nearby Homes
- 5044 Schumard Ct SE
- 278 Emory Ln SE
- 4788 Maine Ave SE
- 5274 Southwood Dr SW
- 5182 Southern Ridge Ln SW
- 4314 Garden Ct SE
- 4311 Daisy Ave SE
- 4300 Garden Ct SE
- 506 Peony St SE
- 4230 Garden Ct SE
- 4225 Garden Ct SE
- 1016 Southern Woods Place SW
- 4226 Fern Ave SE
- 4219 Daffodil Ave SE
- 4230 Daisy Ave SE
- 4204 Garden Ct SE
- XXXX 11th Ave SW
- 4887 Tee Ct SW
- 5512 Leslie Ln SW
- 479 Pointe Ct SW
- 5055 Cherrybark Ln SE
- 5055 5055 Cherrybark-Lane-se Unit 207
- 5055 5055 Cherrybark Ln SE
- 220 Emory Ln SE
- 5051 Cherrybark Ln SE
- 5051 Cherrybark Ln SE Unit 206
- 5059 Cherrybark Ln SE
- 5059 Cherrybark Ln SE Unit 208
- 5051 5051 Cherrybark Ln SE Unit 206
- 220 220 Emory-Lane-n
- 224 Emory Ln SE Unit 203
- 216 Emory Ln SE
- 224 224 Emory-Lane-se
- 216 216 Emory Ln SE
- 216 216 Emory-Lane-se
- 5047 Cherrybark Ln SE
- 228 Emory Ln SE
- 228 228 Emory-Lane-se
- 228 228 Emory Ln SE
- 261 Forest Knoll Place SE