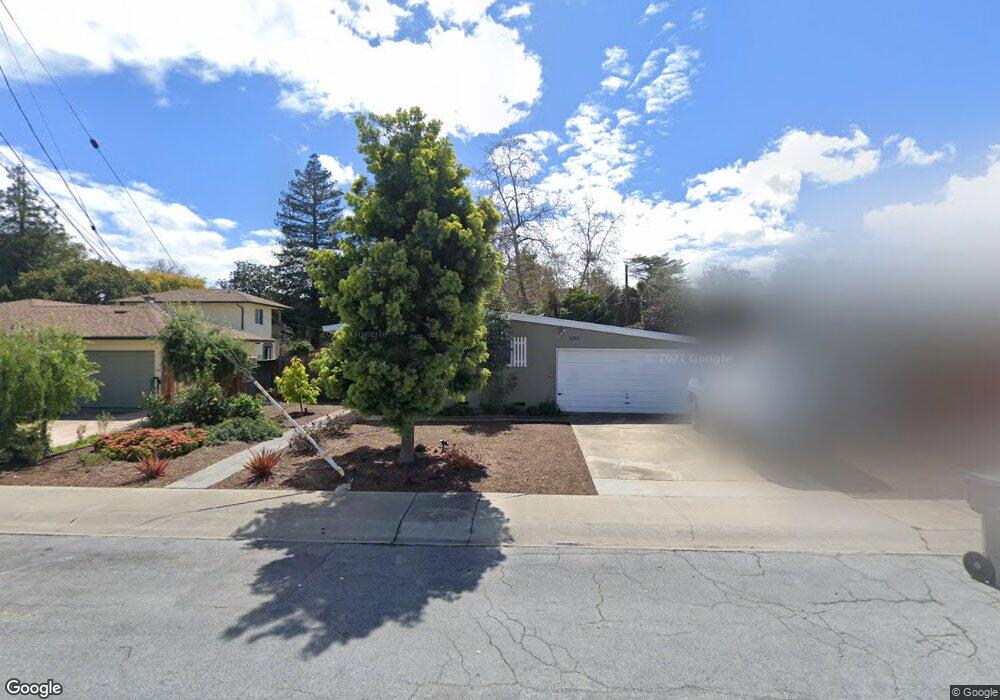
5055 Wilma Way San Jose, CA 95124
Blossom Crest NeighborhoodEstimated Value: $1,868,566 - $2,174,000
3
Beds
2
Baths
1,206
Sq Ft
$1,709/Sq Ft
Est. Value
About This Home
This home is located at 5055 Wilma Way, San Jose, CA 95124 and is currently estimated at $2,060,642, approximately $1,708 per square foot. 5055 Wilma Way is a home located in Santa Clara County with nearby schools including Carlton Elementary School, Union Middle School, and Leigh High School.
Ownership History
Date
Name
Owned For
Owner Type
Purchase Details
Closed on
Jun 13, 2018
Sold by
Daily Beverly J
Bought by
Daily Wayne A and Daily Beverly J
Current Estimated Value
Purchase Details
Closed on
May 11, 2015
Sold by
Duncan William E
Bought by
Duncan William E
Purchase Details
Closed on
Aug 16, 1991
Sold by
Duncan William E and Duncan Juanita I
Bought by
Duncan William E and Duncan Imogene B
Create a Home Valuation Report for This Property
The Home Valuation Report is an in-depth analysis detailing your home's value as well as a comparison with similar homes in the area
Home Values in the Area
Average Home Value in this Area
Purchase History
| Date | Buyer | Sale Price | Title Company |
|---|---|---|---|
| Daily Wayne A | -- | None Available | |
| Daily Beverly J | -- | None Available | |
| Duncan William E | -- | None Available | |
| Duncan William E | -- | -- |
Source: Public Records
Tax History Compared to Growth
Tax History
| Year | Tax Paid | Tax Assessment Tax Assessment Total Assessment is a certain percentage of the fair market value that is determined by local assessors to be the total taxable value of land and additions on the property. | Land | Improvement |
|---|---|---|---|---|
| 2025 | $4,029 | $189,935 | $72,857 | $117,078 |
| 2024 | $4,029 | $186,212 | $71,429 | $114,783 |
| 2023 | $3,913 | $182,562 | $70,029 | $112,533 |
| 2022 | $3,850 | $178,983 | $68,656 | $110,327 |
| 2021 | $3,724 | $175,474 | $67,310 | $108,164 |
| 2020 | $3,604 | $173,675 | $66,620 | $107,055 |
| 2019 | $3,516 | $170,270 | $65,314 | $104,956 |
| 2018 | $3,426 | $166,933 | $64,034 | $102,899 |
| 2017 | $3,374 | $163,661 | $62,779 | $100,882 |
| 2016 | $3,220 | $160,453 | $61,549 | $98,904 |
| 2015 | $3,165 | $158,044 | $60,625 | $97,419 |
| 2014 | $2,721 | $154,949 | $59,438 | $95,511 |
Source: Public Records
Map
Nearby Homes
- 15236 Dickens Ave
- 2291 Samaritan Dr Unit 3
- 15560 Camino Del Cerro
- 4787 Hatfield Walkway Unit 4
- 4768 Hatfield Walk Unit 2
- 200 Westchester Dr
- 2303 Saidel Dr Unit 4
- 2309 Saidel Dr Unit 2
- 2029 Los Gatos Almaden Rd
- 5222 Adalina Ct
- 4593 Fallstone Ct
- 2026 Lynn Ave
- 102 Hildebrand Dr
- 129 Dover St
- 15560 Blossom Hill Rd
- 16100 Jasmine Way
- 1957 Wilfred Way
- 14566 S Bascom Ave
- 3949 Starview Dr
- 16157 E Mozart Ave
- 5051 Wilma Way
- 15341 Wilma Way
- 5047 Wilma Way
- 15351 Wilma Way
- 5048 Wilma Way
- 15340 Wilma Way
- 5010 Wilma Way
- 15271 Winton Way
- 5041 Wilma Way
- 15300 Winton Way
- 5033 Wilma Way
- 15290 Winton Way
- 4998 Wilma Way
- 15261 Winton Way
- 5023 Wilma Way
- 15280 Winton Way
- 5011 Wilma Way
- 15270 Winton Way
- 4986 Wilma Way
- 15251 Winton Way