Estimated Value: $263,000 - $343,000
3
Beds
2
Baths
1,008
Sq Ft
$309/Sq Ft
Est. Value
About This Home
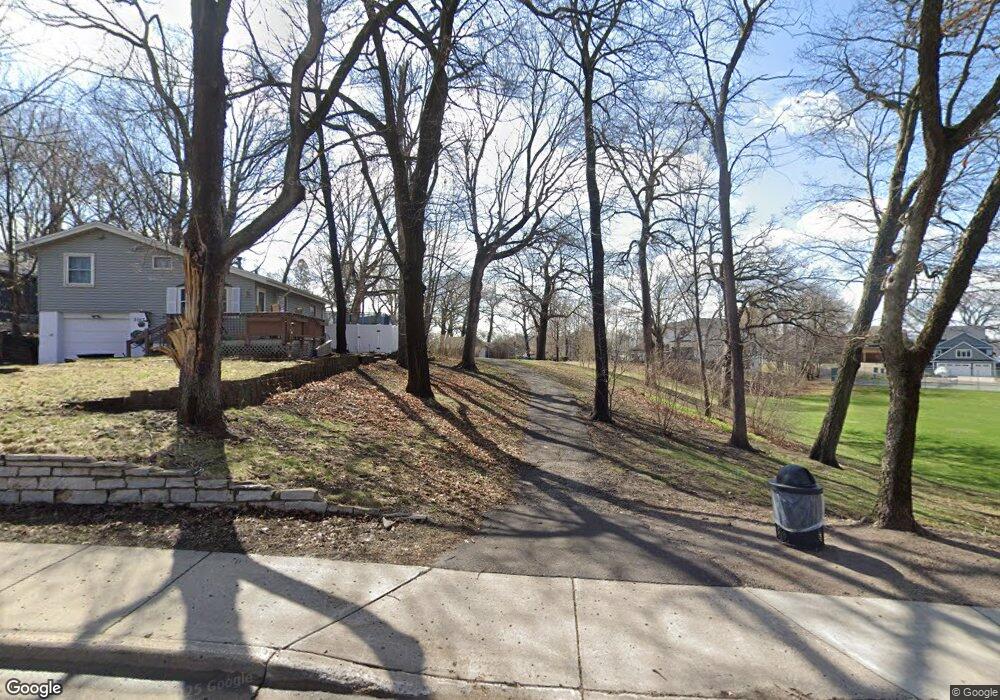
This home is located at 5057 Three Points Blvd, Mound, MN 55364 and is currently estimated at $311,199, approximately $308 per square foot. 5057 Three Points Blvd is a home located in Hennepin County with nearby schools including Hilltop Primary School, Westonka Middle School, and Westonka High School.
Ownership History
Date
Name
Owned For
Owner Type
Purchase Details
Closed on
Jan 10, 2025
Sold by
Monroe Brianne and Monroe William West
Bought by
Kordiak Michelle Joanne
Current Estimated Value
Home Financials for this Owner
Home Financials are based on the most recent Mortgage that was taken out on this home.
Original Mortgage
$212,500
Outstanding Balance
$210,990
Interest Rate
6.69%
Mortgage Type
New Conventional
Estimated Equity
$100,209
Purchase Details
Closed on
Sep 15, 2016
Sold by
Kridel Molly Dawn and Kridel James Simon
Bought by
Monroe William West
Home Financials for this Owner
Home Financials are based on the most recent Mortgage that was taken out on this home.
Original Mortgage
$152,000
Interest Rate
3.43%
Mortgage Type
New Conventional
Purchase Details
Closed on
Jul 14, 2016
Sold by
Blackwell Alan J and Blackwell Elizabeth M
Bought by
Kridel Molly Down and Kridel James Simon
Create a Home Valuation Report for This Property
The Home Valuation Report is an in-depth analysis detailing your home's value as well as a comparison with similar homes in the area
Home Values in the Area
Average Home Value in this Area
Purchase History
| Date | Buyer | Sale Price | Title Company |
|---|---|---|---|
| Kordiak Michelle Joanne | $250,000 | Results Title | |
| Monroe William West | $190,000 | All American Title Co Inc | |
| Kridel Molly Down | $183,000 | All American Title Company |
Source: Public Records
Mortgage History
| Date | Status | Borrower | Loan Amount |
|---|---|---|---|
| Open | Kordiak Michelle Joanne | $212,500 | |
| Previous Owner | Monroe William West | $152,000 |
Source: Public Records
Tax History Compared to Growth
Tax History
| Year | Tax Paid | Tax Assessment Tax Assessment Total Assessment is a certain percentage of the fair market value that is determined by local assessors to be the total taxable value of land and additions on the property. | Land | Improvement |
|---|---|---|---|---|
| 2024 | $2,970 | $288,900 | $93,000 | $195,900 |
| 2023 | $2,915 | $289,600 | $93,000 | $196,600 |
| 2022 | $2,400 | $268,000 | $80,000 | $188,000 |
| 2021 | $2,296 | $220,000 | $64,000 | $156,000 |
| 2020 | $2,181 | $211,000 | $62,000 | $149,000 |
| 2019 | $2,135 | $190,000 | $53,000 | $137,000 |
| 2018 | $2,041 | $185,000 | $53,000 | $132,000 |
| 2017 | $1,616 | $139,000 | $36,000 | $103,000 |
| 2016 | $1,503 | $128,000 | $39,000 | $89,000 |
| 2015 | $1,579 | $132,000 | $43,000 | $89,000 |
| 2014 | -- | $115,000 | $41,000 | $74,000 |
Source: Public Records
Map
Nearby Homes
- 5118 Three Points Blvd
- 4945 Glen Elyn Rd
- 1736 Shorewood Ln
- 1571 Bluebird Ln
- 5400 Three Points Blvd Unit 335
- 5430 Three Points Blvd Unit 131
- 5440 Three Points Blvd Unit 513
- 5440 Three Points Blvd Unit 523
- 5440 Three Points Blvd Unit 525
- 5440 Three Points Blvd Unit 536
- 5450 Three Points Blvd Unit 623
- 2156 Sandy Ln
- 2209 Chateau Ln
- 5441 Lost Lake Ln
- 5457 Lost Lake Ln
- 4485 N Shore Dr
- 4435 N Shore Dr
- 5080 Minneapolis Ave
- 5735 Village Trail Unit 5735
- 5760 Village Trail
- 5049 Three Points Blvd
- 5022 Sparrow Rd
- 5033 Three Points Blvd
- 5040 Three Points Blvd
- 1761 Heron Ln
- 5025 Three Points Blvd
- 1674 Gull Ln
- 5032 Three Points Blvd
- 1668 Gull Ln
- 1749 Heron Ln
- 5016 Three Points Blvd
- 5001 Sparrow Rd
- 5001 Three Points Blvd
- 5008 Wren Rd
- 1662 Gull Ln
- 1685 Gull Ln
- 1780 Hillside Ln
- 1673 Gull Ln
- 1701 Gull Ln
- 5004 Three Points Blvd