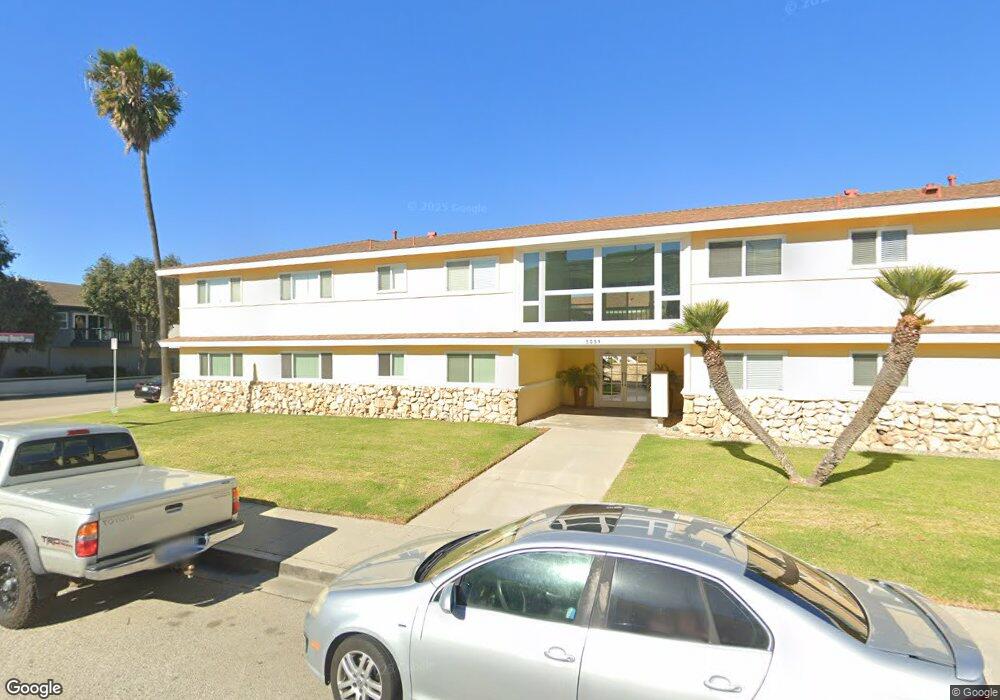
5059 Nautilus St Unit 6 Oxnard, CA 93035
Oxnard Shores NeighborhoodEstimated Value: $543,240 - $622,000
2
Beds
1
Bath
874
Sq Ft
$657/Sq Ft
Est. Value
About This Home
This home is located at 5059 Nautilus St Unit 6, Oxnard, CA 93035 and is currently estimated at $574,310, approximately $657 per square foot. 5059 Nautilus St Unit 6 is a home located in Ventura County with nearby schools including Christa Mcauliffe Elementary School and Oxnard High School.
Ownership History
Date
Name
Owned For
Owner Type
Purchase Details
Closed on
Aug 5, 2025
Sold by
Digrazia Dominic and Digrazia Tammi
Bought by
Digrazia Family Trust and Digrazia
Current Estimated Value
Purchase Details
Closed on
Sep 3, 2021
Sold by
Ramchandani Farah and Ramchandani Tulsi
Bought by
Digrazia Dominic and Digrazia Tammi
Home Financials for this Owner
Home Financials are based on the most recent Mortgage that was taken out on this home.
Original Mortgage
$388,800
Interest Rate
2.8%
Mortgage Type
New Conventional
Purchase Details
Closed on
Nov 27, 2017
Sold by
Ramchandani Tulsi and Ramchandani Farah
Bought by
Ramchandani Farah and Ramchandani Tulsi
Purchase Details
Closed on
Aug 14, 2000
Sold by
Henry Gruszniewski
Bought by
Ramchandani Tulsi and Ramchandani Farah
Home Financials for this Owner
Home Financials are based on the most recent Mortgage that was taken out on this home.
Original Mortgage
$80,500
Interest Rate
7.96%
Create a Home Valuation Report for This Property
The Home Valuation Report is an in-depth analysis detailing your home's value as well as a comparison with similar homes in the area
Home Values in the Area
Average Home Value in this Area
Purchase History
| Date | Buyer | Sale Price | Title Company |
|---|---|---|---|
| Digrazia Family Trust | -- | None Listed On Document | |
| Digrazia Dominic | $442,500 | Fidelity National Title Co | |
| Ramchandani Farah | -- | None Available | |
| Ramchandani Tulsi | $115,000 | First American Title Ins Co |
Source: Public Records
Mortgage History
| Date | Status | Borrower | Loan Amount |
|---|---|---|---|
| Previous Owner | Digrazia Dominic | $388,800 | |
| Previous Owner | Ramchandani Tulsi | $80,500 |
Source: Public Records
Tax History Compared to Growth
Tax History
| Year | Tax Paid | Tax Assessment Tax Assessment Total Assessment is a certain percentage of the fair market value that is determined by local assessors to be the total taxable value of land and additions on the property. | Land | Improvement |
|---|---|---|---|---|
| 2025 | $5,700 | $469,584 | $305,097 | $164,487 |
| 2024 | $5,700 | $460,377 | $299,115 | $161,262 |
| 2023 | $5,492 | $451,350 | $293,250 | $158,100 |
| 2022 | $5,327 | $442,500 | $287,500 | $155,000 |
| 2021 | $1,891 | $153,101 | $61,238 | $91,863 |
| 2020 | $1,926 | $151,533 | $60,611 | $90,922 |
| 2019 | $1,872 | $148,563 | $59,423 | $89,140 |
| 2018 | $1,846 | $145,651 | $58,258 | $87,393 |
| 2017 | $1,754 | $142,796 | $57,116 | $85,680 |
| 2016 | $1,693 | $139,997 | $55,997 | $84,000 |
| 2015 | $1,711 | $137,896 | $55,156 | $82,740 |
| 2014 | $1,692 | $135,197 | $54,077 | $81,120 |
Source: Public Records
Map
Nearby Homes
- 1230 Mandalay Beach Rd
- 1410 Marine Way
- 1417 Marine Way
- 1235 Capri Way
- 1211 Capri Way
- 5125 W Wooley Rd Unit 5
- 1135 Capri Way
- 5121 Breakwater Way
- 4911 Oceanaire St
- 4940 Dunes St
- 5244 Whitecap St
- 4844 Oceanaire St
- 4906 Dunes St
- 5113 Whitecap St
- 1020 Dunes St
- 1068 Canal St
- 5331 Wavecrest Way
- 911 Dunes St
- 5245 Seabreeze Way
- 920 Catamaran St
- 5059 Nautilus St Unit 14
- 5059 Nautilus St Unit 11
- 5059 Nautilus St
- 5059 Nautilus St Unit 15
- 5059 Nautilus St Unit 12
- 5059 Nautilus St Unit 4
- 5059 Nautilus St Unit 1
- 5059 Nautilus St Unit 2
- 5059 Nautilus St Unit 13
- 5059 Nautilus St Unit 10
- 5059 Nautilus St Unit 9
- 5059 Nautilus St Unit 8
- 5059 Nautilus St Unit 5
- 5059 Nautilus St Unit 3
- 1310 Mandalay Beach Rd Unit 1
- 1310 Mandalay Beach Rd
- 1271 Mandalay Beach Rd
- 5045 Nautilus St Unit 7
- 5045 Nautilus St Unit 1
- 5045 Nautilus St Unit 5