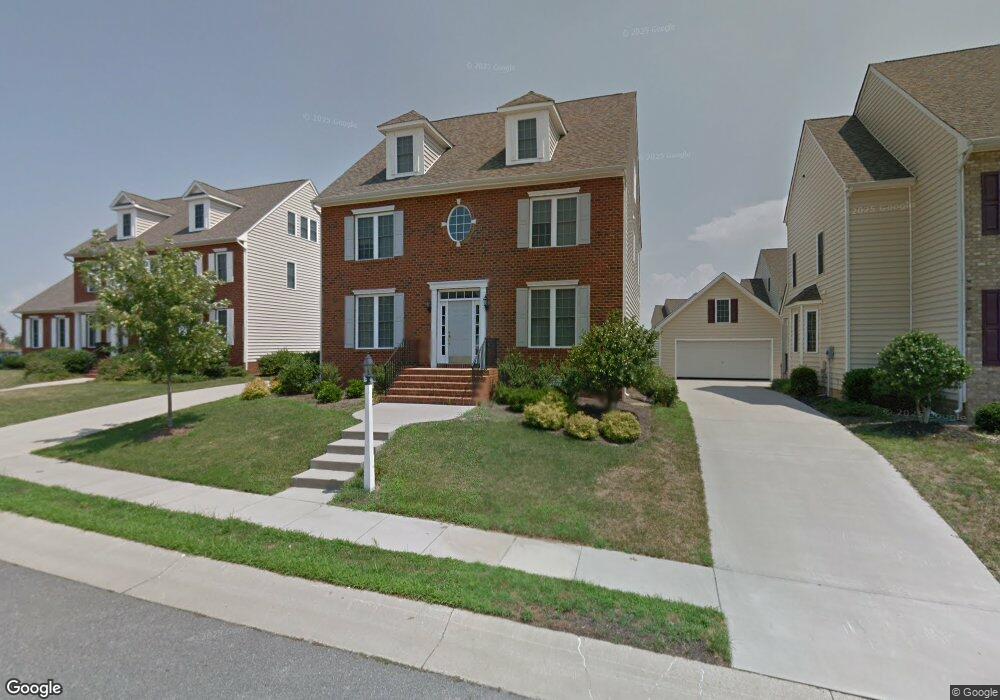
5059 Willows Green Rd Glen Allen, VA 23059
Twin Hickory NeighborhoodEstimated Value: $704,524 - $757,000
6
Beds
4
Baths
3,315
Sq Ft
$220/Sq Ft
Est. Value
About This Home
This home is located at 5059 Willows Green Rd, Glen Allen, VA 23059 and is currently estimated at $728,381, approximately $219 per square foot. 5059 Willows Green Rd is a home located in Henrico County with nearby schools including Twin Hickory Elementary School, Holman Middle School, and Deep Run High School.
Ownership History
Date
Name
Owned For
Owner Type
Purchase Details
Closed on
Jun 2, 2021
Sold by
Govindaraju Shivakumar and Govindaraju Nagamma Geethamuniraju
Bought by
Srivastava Prabhat and Srivastava Swastika
Current Estimated Value
Home Financials for this Owner
Home Financials are based on the most recent Mortgage that was taken out on this home.
Original Mortgage
$483,600
Outstanding Balance
$437,840
Interest Rate
2.9%
Mortgage Type
New Conventional
Estimated Equity
$290,541
Purchase Details
Closed on
Aug 30, 2006
Sold by
H H Hunt Corp
Bought by
Govindaraja Shivakumar and Nagamma,Geethamuniraju
Home Financials for this Owner
Home Financials are based on the most recent Mortgage that was taken out on this home.
Original Mortgage
$346,201
Interest Rate
6.83%
Mortgage Type
New Conventional
Create a Home Valuation Report for This Property
The Home Valuation Report is an in-depth analysis detailing your home's value as well as a comparison with similar homes in the area
Home Values in the Area
Average Home Value in this Area
Purchase History
| Date | Buyer | Sale Price | Title Company |
|---|---|---|---|
| Srivastava Prabhat | $520,000 | Attorney | |
| Govindaraja Shivakumar | $432,752 | -- |
Source: Public Records
Mortgage History
| Date | Status | Borrower | Loan Amount |
|---|---|---|---|
| Open | Srivastava Prabhat | $483,600 | |
| Previous Owner | Govindaraja Shivakumar | $346,201 |
Source: Public Records
Tax History Compared to Growth
Tax History
| Year | Tax Paid | Tax Assessment Tax Assessment Total Assessment is a certain percentage of the fair market value that is determined by local assessors to be the total taxable value of land and additions on the property. | Land | Improvement |
|---|---|---|---|---|
| 2025 | $5,641 | $609,900 | $125,000 | $484,900 |
| 2024 | $5,641 | $562,600 | $125,000 | $437,600 |
| 2023 | $4,782 | $562,600 | $125,000 | $437,600 |
| 2022 | $4,369 | $514,000 | $125,000 | $389,000 |
| 2021 | $3,707 | $414,800 | $100,000 | $314,800 |
| 2020 | $3,609 | $414,800 | $100,000 | $314,800 |
| 2019 | $3,289 | $378,000 | $100,000 | $278,000 |
| 2018 | $3,412 | $392,200 | $100,000 | $292,200 |
| 2017 | $3,437 | $395,000 | $100,000 | $295,000 |
| 2016 | $3,437 | $395,000 | $100,000 | $295,000 |
| 2015 | $3,249 | $373,500 | $90,000 | $283,500 |
| 2014 | $3,249 | $373,500 | $90,000 | $283,500 |
Source: Public Records
Map
Nearby Homes
- 5046 Willows Green Rd
- 918 Jamerson Ln Unit 918
- 5012 Park Commons Loop
- 5004 Parkcrest Ct
- 5132 Park Commons Loop
- 305 Jamerson Ct
- 11944 Belmont Park Ct
- 11532 Saddleridge Rd
- 11700 Autumnwood Ct
- 11539 Sadler Grove Rd
- 5004 Sadler Place Terrace
- 4905 Old Millrace Place
- 5614 Benoni Ct
- 11012 Ellis Meadows Ln
- 11141 Opaca Ln
- 4831 Cedar Branch Ct
- 12109 Oxford Landing Dr Unit 104
- 12109 Oxford Landing Dr Unit 201
- 12109 Oxford Landing Dr Unit 102
- 0 Manakin Rd Unit VAGO2000320
- 5055 Willows Green Rd
- 5063 Willows Green Rd
- 4942 Willows Green Ln
- 5051 Willows Green Rd
- 5062 Willows Green Rd
- 5058 Willows Green Rd
- 5066 Willows Green Rd
- 4938 Willows Green Ln
- 5054 Willows Green Rd
- 5047 Willows Green Rd
- 5070 Willows Green Rd
- 5085 Willows Green Rd
- 4949 Willows Green Ln
- 4953 Willows Green Ln
- 4949 Willows Green Ln
- 4934 Willows Green Ln
- 5074 Willows Green Rd
- 5050 Willows Green Rd
- 4945 Willows Green Ln
- 5043 Willows Green Rd