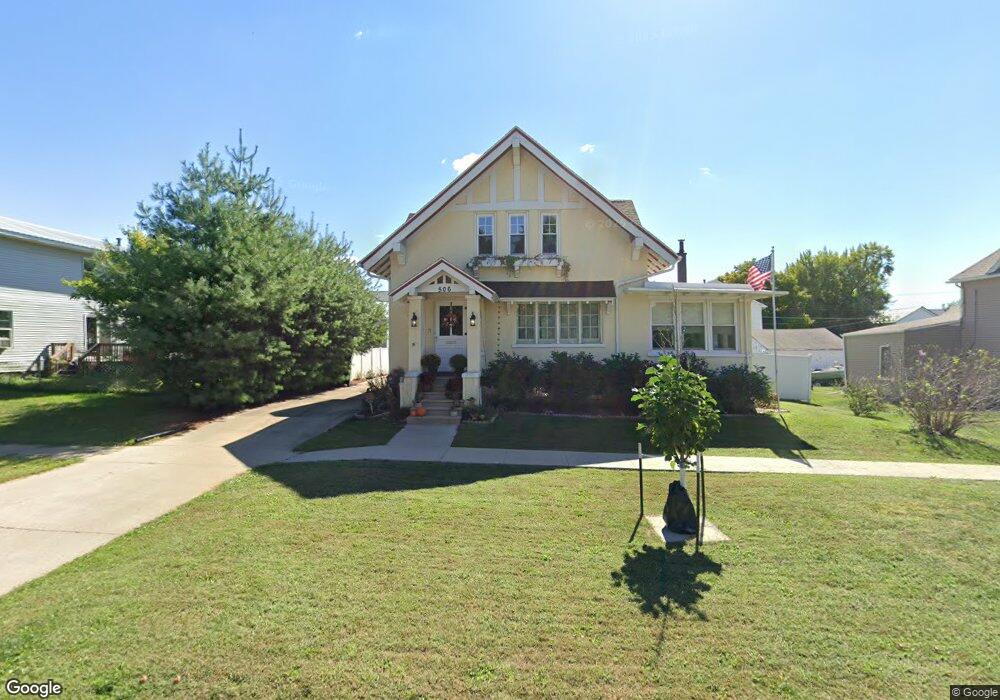
506 E 4th St Vinton, IA 52349
Estimated Value: $171,000 - $207,065
4
Beds
3
Baths
2,776
Sq Ft
$70/Sq Ft
Est. Value
About This Home
This home is located at 506 E 4th St, Vinton, IA 52349 and is currently estimated at $195,016, approximately $70 per square foot. 506 E 4th St is a home located in Benton County with nearby schools including Tilford Elementary School, Shellsburg Elementary School, and Vinton-Shellsburg Middle School.
Ownership History
Date
Name
Owned For
Owner Type
Purchase Details
Closed on
Dec 28, 2017
Sold by
Butterfield Dale L and Butterfield Sharon R
Bought by
Thibadeau Michael R and Thibadeau Lindsey L
Current Estimated Value
Home Financials for this Owner
Home Financials are based on the most recent Mortgage that was taken out on this home.
Original Mortgage
$137,373
Outstanding Balance
$115,536
Interest Rate
3.9%
Mortgage Type
New Conventional
Estimated Equity
$79,480
Create a Home Valuation Report for This Property
The Home Valuation Report is an in-depth analysis detailing your home's value as well as a comparison with similar homes in the area
Home Values in the Area
Average Home Value in this Area
Purchase History
| Date | Buyer | Sale Price | Title Company |
|---|---|---|---|
| Thibadeau Michael R | $136,000 | None Available |
Source: Public Records
Mortgage History
| Date | Status | Borrower | Loan Amount |
|---|---|---|---|
| Open | Thibadeau Michael R | $137,373 |
Source: Public Records
Tax History Compared to Growth
Tax History
| Year | Tax Paid | Tax Assessment Tax Assessment Total Assessment is a certain percentage of the fair market value that is determined by local assessors to be the total taxable value of land and additions on the property. | Land | Improvement |
|---|---|---|---|---|
| 2025 | $2,794 | $186,000 | $15,200 | $170,800 |
| 2024 | $2,794 | $167,800 | $14,600 | $153,200 |
| 2023 | $2,662 | $167,800 | $14,600 | $153,200 |
| 2022 | $2,730 | $136,000 | $11,600 | $124,400 |
| 2021 | $2,730 | $136,000 | $11,600 | $124,400 |
| 2020 | $2,760 | $139,700 | $12,300 | $127,400 |
| 2019 | $2,708 | $139,700 | $12,300 | $127,400 |
| 2018 | $2,696 | $135,300 | $11,800 | $123,500 |
| 2017 | $2,586 | $135,300 | $11,800 | $123,500 |
| 2016 | $2,540 | $126,400 | $11,000 | $115,400 |
| 2015 | $2,540 | $126,400 | $11,000 | $115,400 |
| 2014 | $2,348 | $117,300 | $0 | $0 |
Source: Public Records
Map
Nearby Homes