Estimated Value: $102,648 - $134,000
3
Beds
1
Bath
998
Sq Ft
$119/Sq Ft
Est. Value
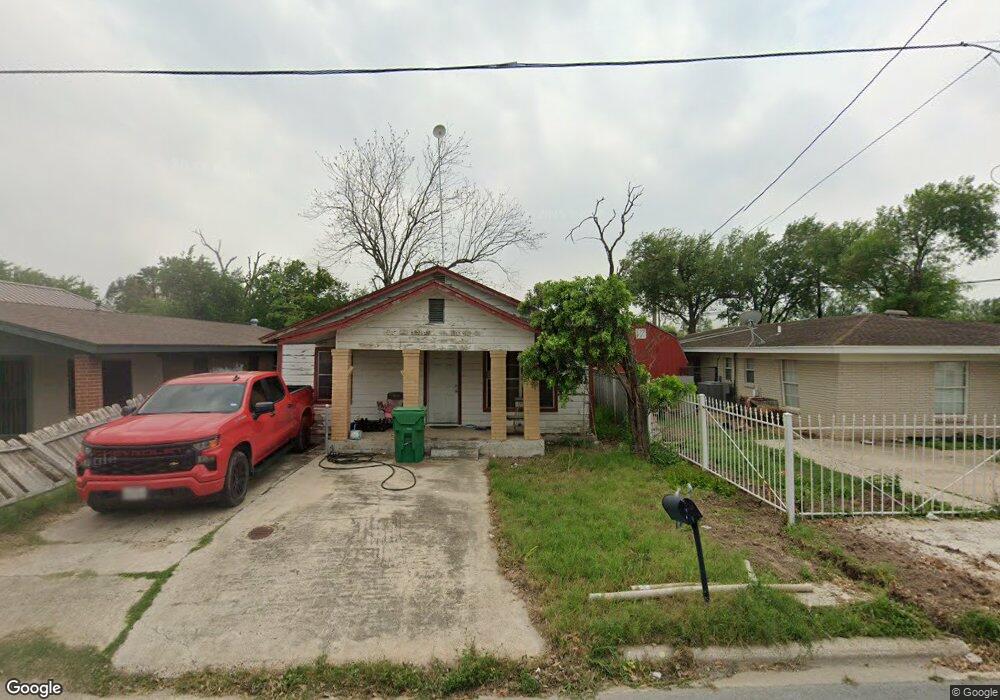
About This Home
This home is located at 506 E Evans Ave, Pharr, TX 78577 and is currently estimated at $118,549, approximately $118 per square foot. 506 E Evans Ave is a home located in Hidalgo County with nearby schools including Henry Ford Elementary, Liberty Middle School, and PSJA North Early College High School.
Create a Home Valuation Report for This Property
The Home Valuation Report is an in-depth analysis detailing your home's value as well as a comparison with similar homes in the area
Home Values in the Area
Average Home Value in this Area
Tax History
| Year | Tax Paid | Tax Assessment Tax Assessment Total Assessment is a certain percentage of the fair market value that is determined by local assessors to be the total taxable value of land and additions on the property. | Land | Improvement |
|---|---|---|---|---|
| 2025 | $1,647 | $70,855 | $26,906 | $43,949 |
| 2024 | $1,647 | $61,397 | $21,525 | $39,872 |
| 2023 | $1,648 | $61,498 | $21,525 | $39,973 |
| 2022 | $1,338 | $47,697 | $12,075 | $35,622 |
| 2021 | $1,178 | $41,224 | $12,075 | $29,149 |
| 2020 | $942 | $32,559 | $12,075 | $20,484 |
| 2019 | $786 | $26,805 | $11,025 | $15,780 |
| 2018 | $791 | $26,830 | $11,025 | $15,805 |
| 2017 | $798 | $26,856 | $11,025 | $15,831 |
| 2016 | $771 | $25,931 | $10,850 | $15,081 |
| 2015 | $314 | $25,955 | $10,850 | $15,105 |
Source: Public Records
Map
Nearby Homes
- 513 E Hawk Ave
- 310 E Hawk Ave
- 214 E Clark Ave
- 250 S Cypress St
- 404 S Dogwood St
- 114 W Clark Ave
- 117 W Hawk Ave
- 813 E Villegas Ave
- 1214 E Sanchez St
- 304 & 306 E Polk Ave
- 129 E Jones Ave
- 1220 E Lucas Ave
- 903 E San Antonio Ave
- 310 W Clark Ave
- 306 W Bell Ave
- 1013 E San Antonio Ave
- 213 E Sam Houston Ave
- 700 E Sam Houston Blvd
- 630 E Sam Houston Ave
- 407 N Veterans Blvd
- 508 E Evans Ave
- 502 E Evans Ave
- 510 E Evans Ave
- 120 N Dogwood St
- 507 E Pena Ave
- 512 E Evans Ave
- 118 N Dogwood St
- 505 E Evans Ave
- 513 E Pena Ave
- 509 E Evans Ave
- 501 E Evans Ave
- 516 E Evans Ave
- 511 E Evans Ave
- 515 E Pena Ave
- 513 E Evans Ave
- 520 E Evans Ave
- 519 E Pena Ave
- 515 E Evans Ave
- 216 N Dogwood St
- 110 N Dogwood St
Your Personal Tour Guide
Ask me questions while you tour the home.