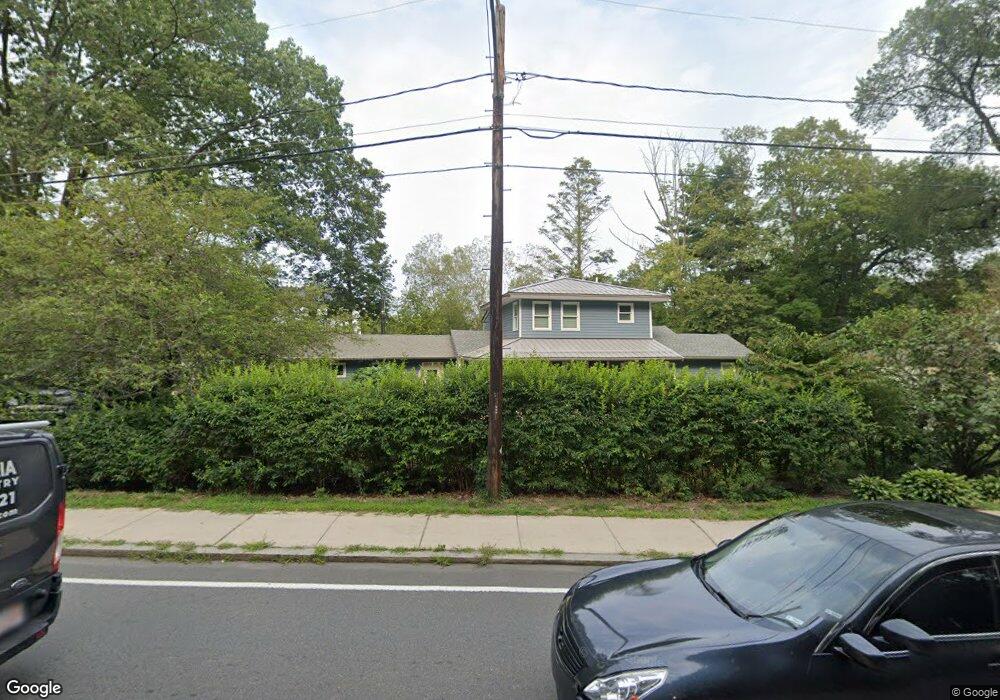
506 Fellsway E Stoneham, MA 02180
Haywardville NeighborhoodEstimated Value: $647,000 - $1,029,000
3
Beds
3
Baths
2,160
Sq Ft
$405/Sq Ft
Est. Value
About This Home
This home is located at 506 Fellsway E, Stoneham, MA 02180 and is currently estimated at $875,237, approximately $405 per square foot. 506 Fellsway E is a home located in Middlesex County with nearby schools including Stoneham High School, St Mary's School, and Melrose Montessori School.
Ownership History
Date
Name
Owned For
Owner Type
Purchase Details
Closed on
May 27, 1999
Sold by
Monson Philip D and Monson Cynthia J
Bought by
Mullen Thomas J and Mullen Jennifer A
Current Estimated Value
Purchase Details
Closed on
Jul 31, 1989
Sold by
New England Mtg Ser
Bought by
Monson Philip D
Create a Home Valuation Report for This Property
The Home Valuation Report is an in-depth analysis detailing your home's value as well as a comparison with similar homes in the area
Home Values in the Area
Average Home Value in this Area
Purchase History
| Date | Buyer | Sale Price | Title Company |
|---|---|---|---|
| Mullen Thomas J | $192,000 | -- | |
| Monson Philip D | $165,000 | -- |
Source: Public Records
Mortgage History
| Date | Status | Borrower | Loan Amount |
|---|---|---|---|
| Open | Monson Philip D | $272,500 | |
| Closed | Monson Philip D | $280,000 | |
| Closed | Monson Philip D | $194,000 |
Source: Public Records
Tax History
| Year | Tax Paid | Tax Assessment Tax Assessment Total Assessment is a certain percentage of the fair market value that is determined by local assessors to be the total taxable value of land and additions on the property. | Land | Improvement |
|---|---|---|---|---|
| 2025 | $8,459 | $826,900 | $361,100 | $465,800 |
| 2024 | $8,051 | $760,200 | $332,600 | $427,600 |
| 2023 | $7,830 | $705,400 | $304,100 | $401,300 |
| 2022 | $6,910 | $663,800 | $285,100 | $378,700 |
| 2021 | $8,380 | $640,000 | $266,100 | $373,900 |
| 2020 | $6,717 | $622,500 | $266,100 | $356,400 |
| 2019 | $5,023 | $447,700 | $247,100 | $200,600 |
| 2018 | $4,799 | $409,800 | $218,600 | $191,200 |
| 2017 | $4,723 | $381,200 | $218,600 | $162,600 |
| 2016 | $4,542 | $357,600 | $204,400 | $153,200 |
| 2015 | $4,469 | $344,800 | $204,400 | $140,400 |
| 2014 | $4,328 | $320,800 | $194,900 | $125,900 |
Source: Public Records
Map
Nearby Homes
- 300 Park Terrace Dr Unit 354
- 24 Lynde Ave
- 355 Washington St
- 7 Executive Dr Unit 233
- 6 Colby Terrace
- 515 Pleasant St Unit 1-1
- 509 Pleasant St Unit 1-4
- 447 Pleasant St
- 35 Maple Rd
- 232 Pleasant St
- 340 Main St Unit 508
- 340 Main St Unit 206
- 333 Main St
- 244 Main St
- 53 Perkins St
- 25 Shadow Rd
- 236-238 Main St
- 77 Lynde St
- 55 Boston Rock Rd
- 132 Walton Park
- 7 Brook St
- 510 Fellsway E
- 5 Brook St
- 500 Fellsway E
- 11 Brook St
- 2 Philips Rd
- 512 Fellsway E
- 4 Philips Rd
- 6 Philips Rd
- 4 Brook St
- 4 Brook St
- 4 Brook St Unit 4
- 2 Brook St
- 492 Fellsway E Unit 494
- 8 Philips Rd
- 292 W Wyoming Ave
- 292 W Wyoming Ave Unit 292
- 292 W Wyoming Ave Unit 1
- 1 Philips Rd
- 3 Philips Rd
Your Personal Tour Guide
Ask me questions while you tour the home.