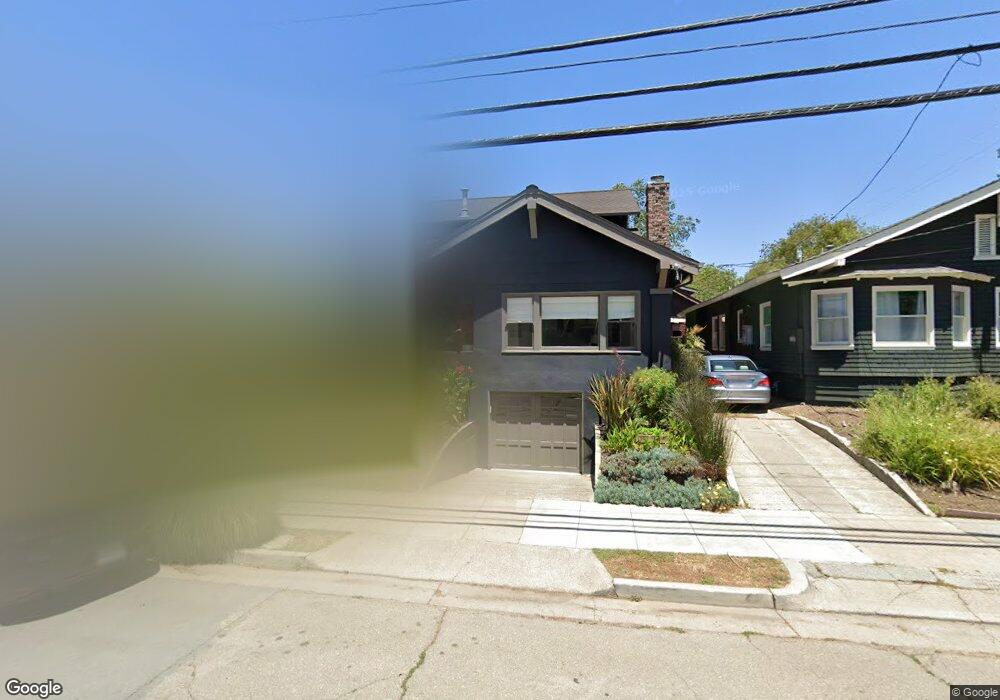
506 Forest St Oakland, CA 94618
Rockridge NeighborhoodEstimated Value: $1,472,000 - $1,989,000
6
Beds
2
Baths
2,248
Sq Ft
$812/Sq Ft
Est. Value
About This Home
This home is located at 506 Forest St, Oakland, CA 94618 and is currently estimated at $1,824,835, approximately $811 per square foot. 506 Forest St is a home located in Alameda County with nearby schools including Chabot Elementary School, Claremont Middle School, and Oakland Technical High School.
Ownership History
Date
Name
Owned For
Owner Type
Purchase Details
Closed on
Jun 7, 2018
Sold by
Wallace Erin and Ackerman Daniel
Bought by
Wallace Erin C
Current Estimated Value
Purchase Details
Closed on
Jan 5, 2016
Sold by
Wallace Erin C and Ackerman Daniel
Bought by
Wallace Erin C and Ackerman Daniel
Home Financials for this Owner
Home Financials are based on the most recent Mortgage that was taken out on this home.
Original Mortgage
$597,500
Outstanding Balance
$523,886
Interest Rate
3.87%
Mortgage Type
Adjustable Rate Mortgage/ARM
Estimated Equity
$1,300,949
Purchase Details
Closed on
Mar 29, 2004
Sold by
Banks William M and William M Banks 1993 Childrens
Bought by
Ackerman Daniel and Wallace Erin C
Home Financials for this Owner
Home Financials are based on the most recent Mortgage that was taken out on this home.
Original Mortgage
$591,000
Interest Rate
4.5%
Mortgage Type
New Conventional
Create a Home Valuation Report for This Property
The Home Valuation Report is an in-depth analysis detailing your home's value as well as a comparison with similar homes in the area
Home Values in the Area
Average Home Value in this Area
Purchase History
| Date | Buyer | Sale Price | Title Company |
|---|---|---|---|
| Wallace Erin C | -- | None Available | |
| Wallace Erin C | -- | Placer Title Company | |
| Ackerman Daniel | $740,000 | Old Republic Title Company |
Source: Public Records
Mortgage History
| Date | Status | Borrower | Loan Amount |
|---|---|---|---|
| Open | Wallace Erin C | $597,500 | |
| Closed | Ackerman Daniel | $591,000 | |
| Closed | Ackerman Daniel | $75,000 |
Source: Public Records
Tax History Compared to Growth
Tax History
| Year | Tax Paid | Tax Assessment Tax Assessment Total Assessment is a certain percentage of the fair market value that is determined by local assessors to be the total taxable value of land and additions on the property. | Land | Improvement |
|---|---|---|---|---|
| 2025 | $14,768 | $1,045,064 | $315,619 | $736,445 |
| 2024 | $14,768 | $1,024,441 | $309,432 | $722,009 |
| 2023 | $15,586 | $1,011,217 | $303,365 | $707,852 |
| 2022 | $15,602 | $984,391 | $297,417 | $693,974 |
| 2021 | $14,808 | $964,960 | $291,588 | $680,372 |
| 2020 | $14,797 | $962,000 | $288,600 | $673,400 |
| 2019 | $14,081 | $943,137 | $282,941 | $660,196 |
| 2018 | $13,786 | $924,644 | $277,393 | $647,251 |
| 2017 | $13,289 | $906,514 | $271,954 | $634,560 |
| 2016 | $12,925 | $888,740 | $266,622 | $622,118 |
| 2015 | $12,861 | $875,390 | $262,617 | $612,773 |
| 2014 | $13,117 | $858,244 | $257,473 | $600,771 |
Source: Public Records
Map
Nearby Homes
- 510 Forest St
- 502 Forest St
- 5621 Oak Grove Ave
- 514 Forest St
- 518 Forest St
- 520 Forest St
- 5625 Oak Grove Ave
- 5720 Claremont Ave
- 511 Forest St
- 524 Forest St
- 507 Forest St
- 5600 Oak Grove Ave
- 5633 Oak Grove Ave
- 515 Forest St
- 5622 Oak Grove Ave
- 519 Forest St
- 503 Forest St
- 5734 Claremont Ave
- 497 Forest St
- 5626 Oak Grove Ave