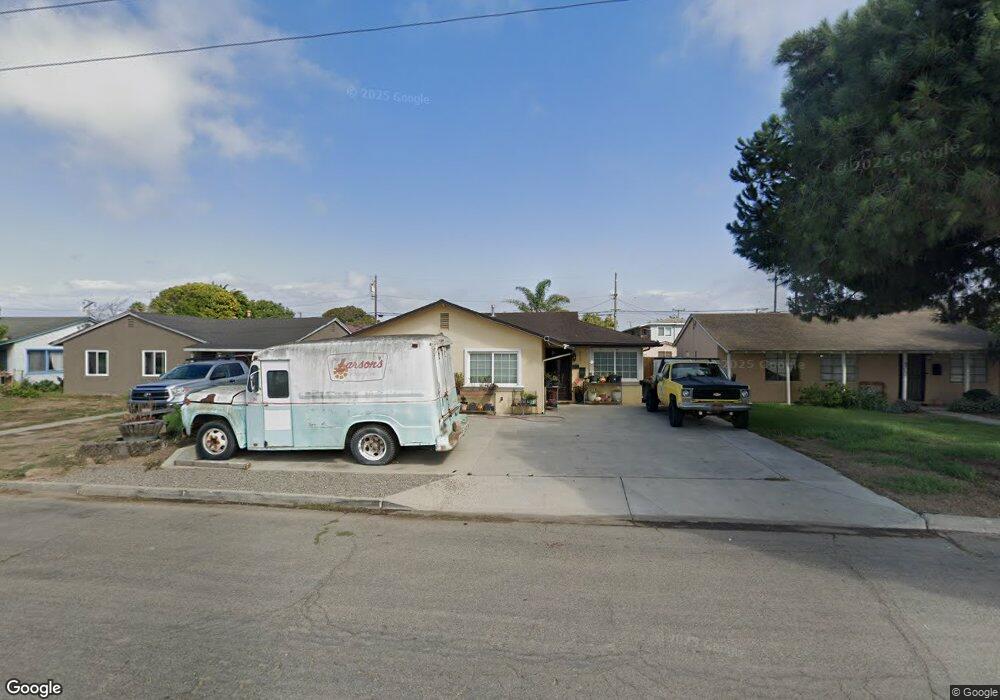
506 N E St Lompoc, CA 93436
Estimated Value: $548,000 - $561,000
3
Beds
2
Baths
1,638
Sq Ft
$338/Sq Ft
Est. Value
About This Home
This home is located at 506 N E St, Lompoc, CA 93436 and is currently estimated at $553,591, approximately $337 per square foot. 506 N E St is a home located in Santa Barbara County with nearby schools including La Honda STEAM Academy, Cabrillo High School, and Olive Grove Charter - Lompoc.
Ownership History
Date
Name
Owned For
Owner Type
Purchase Details
Closed on
Sep 15, 1997
Sold by
Hfs Mobility Services Inc
Bought by
Rodriguez Floriano and Rodriguez Maria E
Current Estimated Value
Home Financials for this Owner
Home Financials are based on the most recent Mortgage that was taken out on this home.
Original Mortgage
$104,346
Interest Rate
7.05%
Mortgage Type
FHA
Purchase Details
Closed on
Jun 27, 1997
Sold by
Whitfield Robert L
Bought by
Hfs Mobility Services Inc
Create a Home Valuation Report for This Property
The Home Valuation Report is an in-depth analysis detailing your home's value as well as a comparison with similar homes in the area
Home Values in the Area
Average Home Value in this Area
Purchase History
| Date | Buyer | Sale Price | Title Company |
|---|---|---|---|
| Rodriguez Floriano | $105,000 | First American Title Co | |
| Hfs Mobility Services Inc | -- | First American Title Co |
Source: Public Records
Mortgage History
| Date | Status | Borrower | Loan Amount |
|---|---|---|---|
| Previous Owner | Rodriguez Floriano | $104,346 |
Source: Public Records
Tax History
| Year | Tax Paid | Tax Assessment Tax Assessment Total Assessment is a certain percentage of the fair market value that is determined by local assessors to be the total taxable value of land and additions on the property. | Land | Improvement |
|---|---|---|---|---|
| 2025 | $1,859 | $167,625 | $87,803 | $79,822 |
| 2023 | $1,859 | $161,118 | $84,395 | $76,723 |
| 2022 | $1,825 | $157,960 | $82,741 | $75,219 |
| 2021 | $1,844 | $154,864 | $81,119 | $73,745 |
| 2020 | $1,825 | $153,277 | $80,288 | $72,989 |
| 2019 | $1,794 | $150,272 | $78,714 | $71,558 |
| 2018 | $1,766 | $147,326 | $77,171 | $70,155 |
| 2017 | $1,734 | $144,438 | $75,658 | $68,780 |
| 2016 | $1,703 | $141,607 | $74,175 | $67,432 |
| 2014 | $1,666 | $136,749 | $71,630 | $65,119 |
Source: Public Records
Map
Nearby Homes
- 533 N G St
- 510 N I St
- 610 E Pine Ave Unit 10
- 610 E Pine Ave Unit 29
- 610 E Pine Ave Unit 62
- 622 N B St
- 505 N 1st St
- 701 E Pine Ave Unit 182
- 701 E Pine Ave Unit 176
- 701 E Pine Ave Unit 171
- 701 E Pine Ave Unit 161
- 526 N L St
- 801, 851 California 246
- 321 N Third St
- 240 Quail Cir
- 117 S I St
- 205 S E St
- 217 N M St
- 321 W North Ave Unit 133
- 215 S H St
Your Personal Tour Guide
Ask me questions while you tour the home.