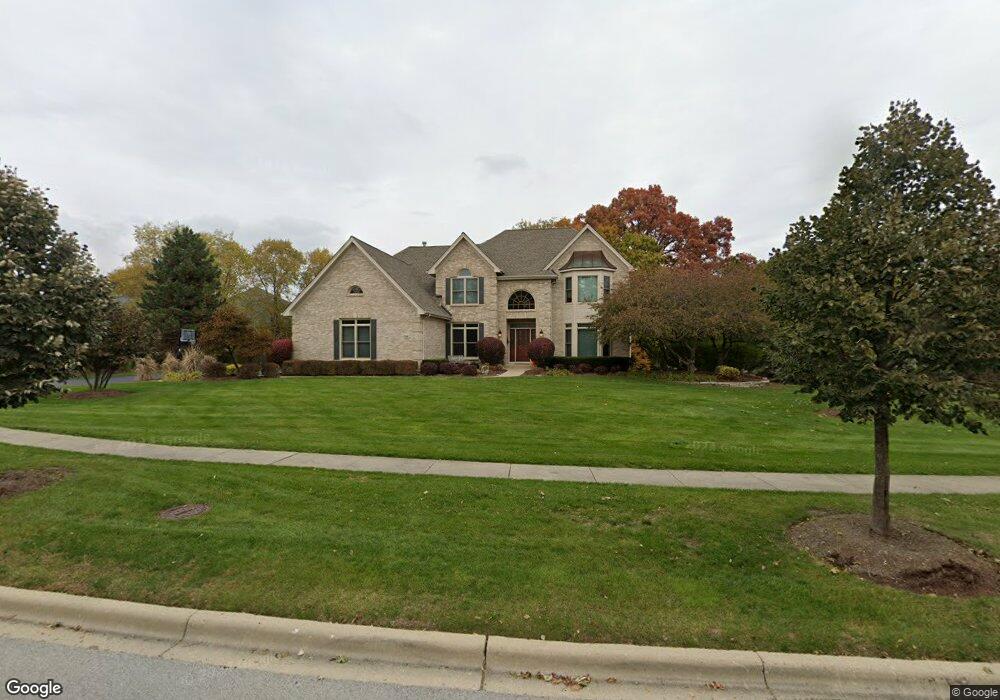
506 Oxmoor Ct Unit 6 Saint Charles, IL 60175
Farmington-Fox River Valley NeighborhoodEstimated Value: $780,000 - $872,000
4
Beds
2
Baths
3,344
Sq Ft
$245/Sq Ft
Est. Value
About This Home
This home is located at 506 Oxmoor Ct Unit 6, Saint Charles, IL 60175 and is currently estimated at $820,443, approximately $245 per square foot. 506 Oxmoor Ct Unit 6 is a home located in Kane County with nearby schools including Wild Rose Elementary School, Wredling Middle School, and St Charles North High School.
Ownership History
Date
Name
Owned For
Owner Type
Purchase Details
Closed on
Jun 11, 2021
Sold by
Oriold Frank E and Frank E Oriold Revocable Trust
Bought by
Vanderheyden Marie J and Vanderheyden Amanda J
Current Estimated Value
Home Financials for this Owner
Home Financials are based on the most recent Mortgage that was taken out on this home.
Original Mortgage
$400,000
Outstanding Balance
$361,295
Interest Rate
2.75%
Mortgage Type
New Conventional
Estimated Equity
$459,148
Purchase Details
Closed on
Sep 30, 2019
Sold by
Oriold Faith G and Oriold Frank E
Bought by
Frank E Oriold Revocable Trust
Purchase Details
Closed on
Jun 2, 2001
Sold by
Oriold Frank E and Oriold Faith G
Bought by
Oriold Faith G and Oriold Frank E
Purchase Details
Closed on
Aug 22, 1996
Sold by
Westway Construction Corp
Bought by
Oriold Frank E and Oriold Faith G
Home Financials for this Owner
Home Financials are based on the most recent Mortgage that was taken out on this home.
Original Mortgage
$175,000
Interest Rate
7.12%
Create a Home Valuation Report for This Property
The Home Valuation Report is an in-depth analysis detailing your home's value as well as a comparison with similar homes in the area
Home Values in the Area
Average Home Value in this Area
Purchase History
| Date | Buyer | Sale Price | Title Company |
|---|---|---|---|
| Vanderheyden Marie J | $600,000 | Chicago Title | |
| Frank E Oriold Revocable Trust | -- | None Available | |
| Oriold Faith G | -- | -- | |
| Oriold Frank E | $468,000 | Fox Title Company |
Source: Public Records
Mortgage History
| Date | Status | Borrower | Loan Amount |
|---|---|---|---|
| Open | Vanderheyden Marie J | $400,000 | |
| Previous Owner | Oriold Frank E | $175,000 |
Source: Public Records
Tax History
| Year | Tax Paid | Tax Assessment Tax Assessment Total Assessment is a certain percentage of the fair market value that is determined by local assessors to be the total taxable value of land and additions on the property. | Land | Improvement |
|---|---|---|---|---|
| 2024 | $15,306 | $212,982 | $40,964 | $172,018 |
| 2023 | $14,706 | $190,622 | $36,663 | $153,959 |
| 2022 | $13,783 | $175,861 | $38,552 | $137,309 |
| 2021 | $13,250 | $167,631 | $36,748 | $130,883 |
| 2020 | $13,113 | $164,506 | $36,063 | $128,443 |
| 2019 | $12,881 | $161,249 | $35,349 | $125,900 |
| 2018 | $12,992 | $161,684 | $35,795 | $125,889 |
| 2017 | $13,504 | $166,110 | $34,571 | $131,539 |
| 2016 | $14,945 | $168,646 | $33,357 | $135,289 |
| 2015 | -- | $165,556 | $32,997 | $132,559 |
| 2014 | -- | $162,330 | $32,997 | $129,333 |
| 2013 | -- | $162,708 | $33,327 | $129,381 |
Source: Public Records
Map
Nearby Homes
- 5N195 Dover Hill Rd
- 36W442 Hunters Gate Rd
- 3104 Easton Place
- 3818 Grand View Ct
- 5N024 Il Route 31
- 4N881 Old Farm Rd
- 4N675 Old Farm Rd
- 4N680 Ware Woods Dr
- 5N092 Grove Ave
- 37W004 Ridgewood Dr
- 6N263 River Dr
- 000 Riverside Dr
- 813 Fox Glen Dr
- 35W247 Fox River Dr
- lot 012 Tuscola Ave
- 34W791 Army Trail Rd
- 4016 Faith Ln
- 4032 Faith Ln
- 4009 Faith Ln
- 2450 Persimmon Dr
- 508 Oxmoor Ct Unit 6
- 3604 Greenwood Ln Unit 6
- 3502 Greenwood Ln
- 505 Oxmoor Ct Unit 6
- 502 Oxmoor Ct Unit 6
- 3606 Greenwood Ln Unit 6
- 503 Oxmoor Ct Unit 6
- 3406 Greenwood Ln Unit 5
- 501 Oxmoor Ct Unit 6
- 3603 Greenwood Ln Unit 6
- 3601 Greenwood Ln
- 3605 Greenwood Ln Unit 6
- 602 Chesapeake Rd
- 3608 Greenwood Ln
- 3607 Greenwood Ln
- 3404 Greenwood Ln Unit 4
- 3702 Greenwood Ln
- 604 Chesapeake Rd Unit 5
- 601 Chesapeake Rd Unit 5
- 36w Fieldcrest Dr
Your Personal Tour Guide
Ask me questions while you tour the home.