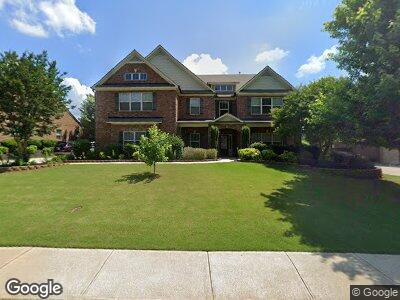
5060 Savannah Run Cumming, GA 30040
Estimated Value: $761,000 - $1,062,000
6
Beds
5
Baths
4,216
Sq Ft
$229/Sq Ft
Est. Value
About This Home
This home is located at 5060 Savannah Run, Cumming, GA 30040 and is currently estimated at $963,620, approximately $228 per square foot. 5060 Savannah Run is a home located in Forsyth County with nearby schools including Kelly Mill Elementary School, West Forsyth High School, and Montessori School of Cumming.
Ownership History
Date
Name
Owned For
Owner Type
Purchase Details
Closed on
Jun 1, 2011
Sold by
Fidelity Bk
Bought by
Bk Residential Construction Ll
Current Estimated Value
Home Financials for this Owner
Home Financials are based on the most recent Mortgage that was taken out on this home.
Original Mortgage
$336,336
Interest Rate
3.75%
Mortgage Type
New Conventional
Purchase Details
Closed on
May 16, 2011
Sold by
Bk Resdl Construction Llc
Bought by
Curtis Kevin and Curtis Traci W
Home Financials for this Owner
Home Financials are based on the most recent Mortgage that was taken out on this home.
Original Mortgage
$336,336
Interest Rate
3.75%
Mortgage Type
New Conventional
Purchase Details
Closed on
Nov 16, 2010
Sold by
Gdci Ga 1 Lp
Bought by
Bk Residential Const Llc
Home Financials for this Owner
Home Financials are based on the most recent Mortgage that was taken out on this home.
Original Mortgage
$698,250
Interest Rate
4.3%
Create a Home Valuation Report for This Property
The Home Valuation Report is an in-depth analysis detailing your home's value as well as a comparison with similar homes in the area
Home Values in the Area
Average Home Value in this Area
Purchase History
| Date | Buyer | Sale Price | Title Company |
|---|---|---|---|
| Bk Residential Construction Ll | -- | -- | |
| Curtis Kevin | $420,500 | -- | |
| Bk Residential Const Llc | $170,000 | -- |
Source: Public Records
Mortgage History
| Date | Status | Borrower | Loan Amount |
|---|---|---|---|
| Open | Curtis Kevin | $585,990 | |
| Closed | Curtis Kevin | $497,352 | |
| Closed | Curtis Kevin M | $486,771 | |
| Closed | -- | $485,212 | |
| Closed | Curtis Kevin M | $100,000 | |
| Closed | Curtis Kevin | $336,336 | |
| Previous Owner | Bk Residential Const Llc | $698,250 |
Source: Public Records
Tax History Compared to Growth
Tax History
| Year | Tax Paid | Tax Assessment Tax Assessment Total Assessment is a certain percentage of the fair market value that is determined by local assessors to be the total taxable value of land and additions on the property. | Land | Improvement |
|---|---|---|---|---|
| 2024 | $7,405 | $363,796 | $64,000 | $299,796 |
| 2023 | $6,779 | $345,356 | $60,000 | $285,356 |
| 2022 | $6,492 | $227,852 | $34,000 | $193,852 |
| 2021 | $5,786 | $227,852 | $34,000 | $193,852 |
| 2020 | $5,566 | $217,188 | $34,000 | $183,188 |
| 2019 | $5,234 | $200,720 | $34,000 | $166,720 |
| 2018 | $5,729 | $223,572 | $34,000 | $189,572 |
| 2017 | $5,232 | $199,020 | $34,000 | $165,020 |
| 2016 | $5,156 | $195,420 | $30,400 | $165,020 |
| 2015 | $5,166 | $195,420 | $30,400 | $165,020 |
| 2014 | $4,556 | $177,860 | $0 | $0 |
Source: Public Records
Map
Nearby Homes
- 5060 Savannah Run
- 5070 Savannah Run
- 5055 Savannah Run Unit 31
- 5055 Savannah Run
- 5050 Savannah Run
- 5065 Savannah Run
- 5045 Savannah Run
- 5105 Savannah Run
- 5045 Chase Ln
- 5035 Chase Ln
- 5075 Savannah Run
- 5040 Savannah Run
- 5090 Savannah Run
- 5025 Chase Ln
- 5055 Chase Ln
- 0 Savannah Run Unit 141 7264078
- 0 Savannah Run Unit 8647239
- 0 Savannah Run Unit 8597657
- 0 Savannah Run Unit 8562616
- 0 Savannah Run Unit 8214440