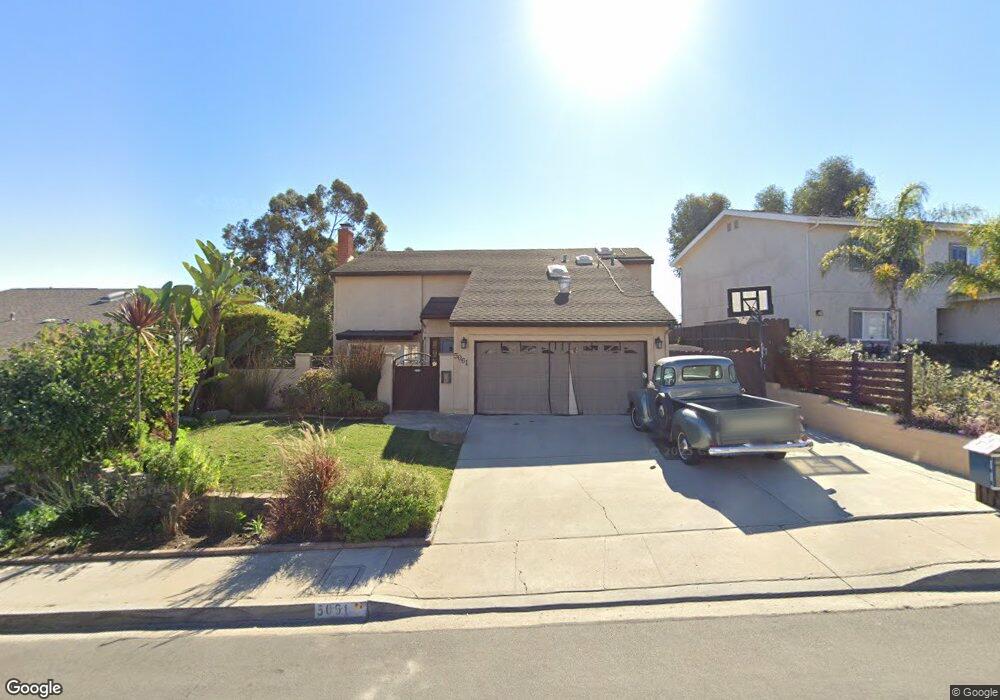
5061 Via Cinta San Diego, CA 92122
University City NeighborhoodEstimated Value: $1,715,183 - $1,855,000
4
Beds
3
Baths
2,370
Sq Ft
$754/Sq Ft
Est. Value
About This Home
This home is located at 5061 Via Cinta, San Diego, CA 92122 and is currently estimated at $1,787,546, approximately $754 per square foot. 5061 Via Cinta is a home located in San Diego County with nearby schools including Marie Curie Elementary School, Standley Middle School, and University City High School.
Ownership History
Date
Name
Owned For
Owner Type
Purchase Details
Closed on
Apr 8, 2004
Sold by
Stern Steven and Stern Joyce C
Bought by
Stern Steven J and Stern Joyce C
Current Estimated Value
Home Financials for this Owner
Home Financials are based on the most recent Mortgage that was taken out on this home.
Original Mortgage
$289,000
Interest Rate
4.87%
Mortgage Type
New Conventional
Purchase Details
Closed on
Nov 4, 1999
Sold by
Stern Steven J
Bought by
Stern Steven J and Stern Joyce C
Purchase Details
Closed on
Apr 19, 1995
Sold by
Stern Lorna
Bought by
Stern Steven J
Purchase Details
Closed on
Jun 14, 1989
Create a Home Valuation Report for This Property
The Home Valuation Report is an in-depth analysis detailing your home's value as well as a comparison with similar homes in the area
Home Values in the Area
Average Home Value in this Area
Purchase History
| Date | Buyer | Sale Price | Title Company |
|---|---|---|---|
| Stern Steven J | -- | -- | |
| Stern Steven | -- | United Title Company San Die | |
| Stern Steven J | -- | -- | |
| Stern Steven J | -- | -- | |
| -- | $289,000 | -- |
Source: Public Records
Mortgage History
| Date | Status | Borrower | Loan Amount |
|---|---|---|---|
| Closed | Stern Steven | $289,000 |
Source: Public Records
Tax History Compared to Growth
Tax History
| Year | Tax Paid | Tax Assessment Tax Assessment Total Assessment is a certain percentage of the fair market value that is determined by local assessors to be the total taxable value of land and additions on the property. | Land | Improvement |
|---|---|---|---|---|
| 2025 | $7,438 | $621,995 | $189,960 | $432,035 |
| 2024 | $7,438 | $609,800 | $186,236 | $423,564 |
| 2023 | $7,272 | $597,844 | $182,585 | $415,259 |
| 2022 | $7,077 | $586,122 | $179,005 | $407,117 |
| 2021 | $7,027 | $574,631 | $175,496 | $399,135 |
| 2020 | $6,941 | $568,740 | $173,697 | $395,043 |
| 2019 | $6,816 | $557,590 | $170,292 | $387,298 |
| 2018 | $6,371 | $546,657 | $166,953 | $379,704 |
| 2017 | $6,218 | $535,939 | $163,680 | $372,259 |
| 2016 | $6,118 | $525,431 | $160,471 | $364,960 |
| 2015 | $6,026 | $517,539 | $158,061 | $359,478 |
| 2014 | $5,930 | $507,402 | $154,965 | $352,437 |
Source: Public Records
Map
Nearby Homes
- 5266 Diane Ave
- 5448 Noah Way
- 4612 Benhurst Ave
- 5165 Winthrop St
- 5162 Limerick Ave
- 5191 Millwood Rd
- 5284 Winthrop St
- 5889 Cozzens St
- 7212 Florey St
- 5302 Lehrer Dr
- 7056 Haworth St
- 5111 Roscrea Ave
- 5101 Roscrea Ave
- 4972 Ensign St
- 4224 Governor Dr
- 4635 Pauling Ave
- 5192 Providence Rd
- 6214 Agee St Unit 34
- 5170 Clairemont Mesa Blvd Unit 27
- 4874 Longford St
- 5041 Via Cinta
- 5081 Via Cinta
- 5031 Via Cinta
- 5093 Via Cinta
- 5021 Via Cinta
- 5105 Via Cinta
- 5064 Via Cinta
- 5052 Via Cinta
- 5078 Via Cinta
- 5009 Via Cinta
- 5040 Via Cinta
- 5090 Via Cinta
- 5028 Via Cinta
- 5117 Via Cinta
- 4997 Via Cinta
- 5016 Via Cinta
- 5104 Via Cinta
- 5004 Via Cinta
- 5013 Maynard St
- 4995 Maynard St