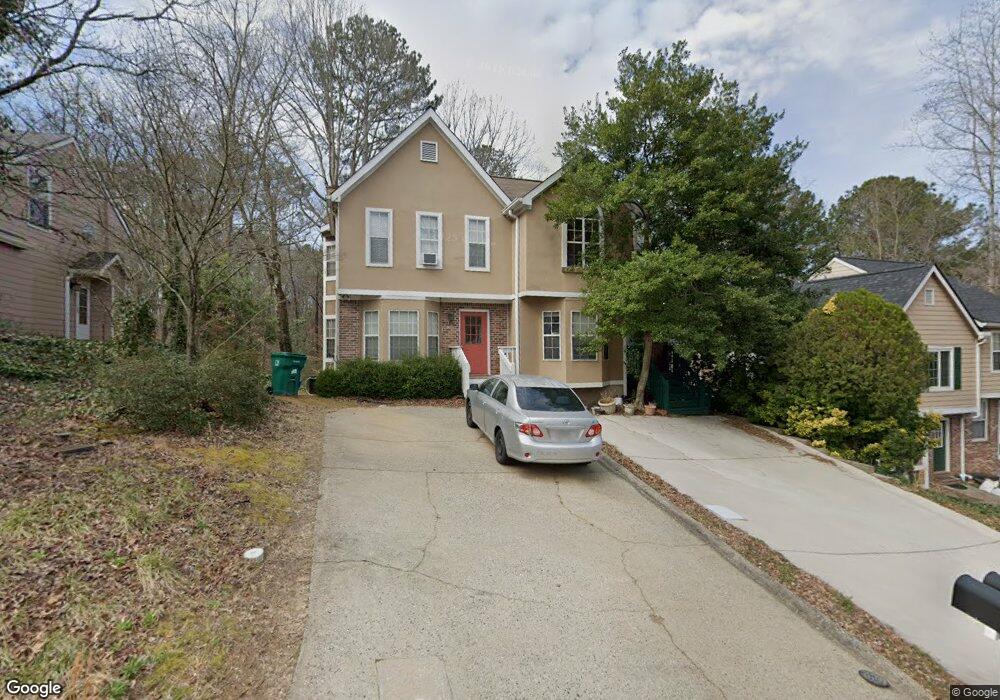
5062 Laurel Bridge Dr SE Smyrna, GA 30082
Estimated Value: $268,604 - $293,000
2
Beds
3
Baths
1,294
Sq Ft
$216/Sq Ft
Est. Value
About This Home
This home is located at 5062 Laurel Bridge Dr SE, Smyrna, GA 30082 and is currently estimated at $280,151, approximately $216 per square foot. 5062 Laurel Bridge Dr SE is a home located in Cobb County with nearby schools including Nickajack Elementary School, Griffin Middle School, and Campbell High School.
Ownership History
Date
Name
Owned For
Owner Type
Purchase Details
Closed on
Nov 17, 2020
Sold by
Hullemeyer Janice
Bought by
Said Hashem A
Current Estimated Value
Home Financials for this Owner
Home Financials are based on the most recent Mortgage that was taken out on this home.
Original Mortgage
$208,160
Interest Rate
2.71%
Mortgage Type
FHA
Purchase Details
Closed on
Oct 31, 2016
Sold by
Vickery Anne R
Bought by
Hullemeyer Janice
Home Financials for this Owner
Home Financials are based on the most recent Mortgage that was taken out on this home.
Original Mortgage
$107,600
Interest Rate
3.42%
Mortgage Type
New Conventional
Purchase Details
Closed on
Jul 26, 2004
Sold by
Spillers Beverly A
Bought by
Vickery Anne R
Home Financials for this Owner
Home Financials are based on the most recent Mortgage that was taken out on this home.
Original Mortgage
$134,500
Interest Rate
6%
Mortgage Type
New Conventional
Create a Home Valuation Report for This Property
The Home Valuation Report is an in-depth analysis detailing your home's value as well as a comparison with similar homes in the area
Home Values in the Area
Average Home Value in this Area
Purchase History
| Date | Buyer | Sale Price | Title Company |
|---|---|---|---|
| Said Hashem A | $212,000 | None Available | |
| Hullemeyer Janice | $134,500 | -- | |
| Vickery Anne R | $134,500 | -- |
Source: Public Records
Mortgage History
| Date | Status | Borrower | Loan Amount |
|---|---|---|---|
| Previous Owner | Said Hashem A | $208,160 | |
| Previous Owner | Hullemeyer Janice | $107,600 | |
| Previous Owner | Vickery Anne R | $134,500 |
Source: Public Records
Tax History Compared to Growth
Tax History
| Year | Tax Paid | Tax Assessment Tax Assessment Total Assessment is a certain percentage of the fair market value that is determined by local assessors to be the total taxable value of land and additions on the property. | Land | Improvement |
|---|---|---|---|---|
| 2025 | $2,399 | $112,720 | $24,000 | $88,720 |
| 2024 | $2,399 | $112,720 | $24,000 | $88,720 |
| 2023 | $1,634 | $97,960 | $20,000 | $77,960 |
| 2022 | $1,812 | $80,548 | $20,000 | $60,548 |
| 2021 | $1,822 | $80,548 | $20,000 | $60,548 |
| 2020 | $1,829 | $66,548 | $18,000 | $48,548 |
| 2019 | $1,726 | $62,776 | $18,000 | $44,776 |
| 2018 | $1,602 | $58,268 | $16,000 | $42,268 |
| 2017 | $1,337 | $51,824 | $7,200 | $44,624 |
| 2016 | $685 | $36,456 | $8,000 | $28,456 |
| 2015 | $480 | $28,024 | $7,200 | $20,824 |
| 2014 | $484 | $28,024 | $0 | $0 |
Source: Public Records
Map
Nearby Homes
- 5188 Laurel Bridge Ct SE
- 1631 Wehunt Place SE Unit 14
- 5033 David Place SE
- 4644 Wehunt Commons Dr SE Unit 31
- 1529 Slopeside Loop SE
- 308 Holbrook Rd Unit 11
- 1554 Cooper Lake Rd SE
- 4781 Highside Way SE
- 0 Gaylor St Unit 10203409
- 0 Gaylor St Unit 7275195
- 1292 Creekside Terrace SE
- 1286 Creekside Terrace SE
- 109 Wetherbrooke Ln
- 1266 Creekside Terrace SE
- 1222 Creekside Place SE
- 2158 Berryhill Cir SE
- 4368 Laurel Cir SE
- 4343 Ivy Glen Ct SE
- 5060 Laurel Bridge Dr SE Unit III
- 5064 Laurel Bridge Dr SE
- 5066 Laurel Bridge Dr SE
- 5058 Laurel Bridge Dr SE
- 5068 Laurel Bridge Dr SE
- 5070 Laurel Bridge Dr SE Unit 3
- 5206 Laurel Bridge Ct SE
- 5204 Laurel Bridge Ct SE
- 5114 Laurel Bridge Dr SE
- 5112 Laurel Bridge Dr SE
- 5072 Laurel Bridge Dr SE Unit N/a
- 5072 Laurel Bridge Dr SE
- 5056 Laurel Bridge Dr SE
- 5110 Laurel Bridge Dr SE
- 5202 Laurel Bridge Ct SE
- 5108 Laurel Bridge Dr SE Unit n/a
- 5108 Laurel Bridge Dr SE
- 5074 Laurel Bridge Dr SE
- 5061 Laurel Springs Way SE
- 5200 Laurel Bridge Ct SE