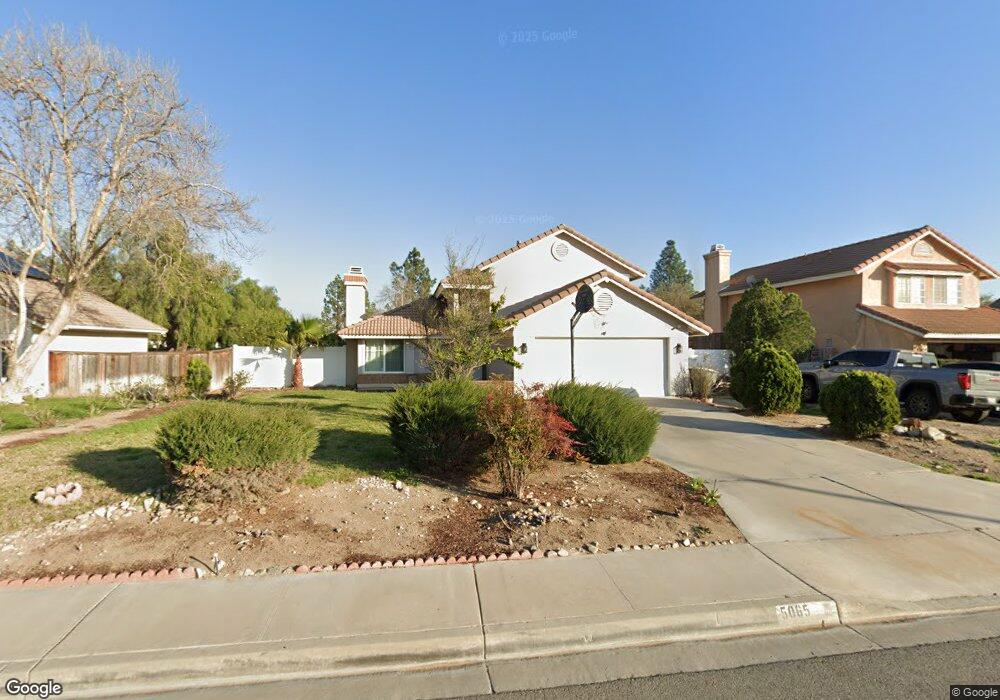
5065 Cambridge Ave San Bernardino, CA 92407
Kendall NeighborhoodEstimated Value: $565,000 - $595,000
4
Beds
3
Baths
1,753
Sq Ft
$330/Sq Ft
Est. Value
About This Home
This home is located at 5065 Cambridge Ave, San Bernardino, CA 92407 and is currently estimated at $577,643, approximately $329 per square foot. 5065 Cambridge Ave is a home located in San Bernardino County with nearby schools including Kendall Elementary School, Shandin Hills Middle School, and Cajon High School.
Ownership History
Date
Name
Owned For
Owner Type
Purchase Details
Closed on
Dec 4, 2020
Sold by
Paez Helen P
Bought by
Paez Helen P and Helen Paez Trust
Current Estimated Value
Purchase Details
Closed on
Jan 27, 2015
Sold by
Paez Eduardo G and Paez Helen P
Bought by
Paez Helen P
Home Financials for this Owner
Home Financials are based on the most recent Mortgage that was taken out on this home.
Original Mortgage
$281,500
Interest Rate
3.76%
Mortgage Type
New Conventional
Purchase Details
Closed on
Nov 26, 2003
Sold by
Magilligan Helen P
Bought by
Magilligan Helen P
Home Financials for this Owner
Home Financials are based on the most recent Mortgage that was taken out on this home.
Original Mortgage
$160,000
Interest Rate
6.04%
Mortgage Type
Purchase Money Mortgage
Purchase Details
Closed on
Sep 29, 1999
Sold by
Magilligan Daniel L
Bought by
Magilligan Helen P
Create a Home Valuation Report for This Property
The Home Valuation Report is an in-depth analysis detailing your home's value as well as a comparison with similar homes in the area
Home Values in the Area
Average Home Value in this Area
Purchase History
| Date | Buyer | Sale Price | Title Company |
|---|---|---|---|
| Paez Helen P | -- | None Available | |
| Paez Helen P | -- | First American Title | |
| Magilligan Helen P | -- | New Century Title Company | |
| Magilligan Helen P | -- | -- |
Source: Public Records
Mortgage History
| Date | Status | Borrower | Loan Amount |
|---|---|---|---|
| Closed | Paez Helen P | $281,500 | |
| Closed | Magilligan Helen P | $160,000 |
Source: Public Records
Tax History Compared to Growth
Tax History
| Year | Tax Paid | Tax Assessment Tax Assessment Total Assessment is a certain percentage of the fair market value that is determined by local assessors to be the total taxable value of land and additions on the property. | Land | Improvement |
|---|---|---|---|---|
| 2025 | $3,485 | $268,582 | $50,780 | $217,802 |
| 2024 | $3,485 | $263,315 | $49,784 | $213,531 |
| 2023 | $3,399 | $258,152 | $48,808 | $209,344 |
| 2022 | $3,404 | $253,090 | $47,851 | $205,239 |
| 2021 | $3,410 | $248,128 | $46,913 | $201,215 |
| 2020 | $3,418 | $245,584 | $46,432 | $199,152 |
| 2019 | $3,318 | $240,769 | $45,522 | $195,247 |
| 2018 | $3,282 | $236,048 | $44,629 | $191,419 |
| 2017 | $3,182 | $231,420 | $43,754 | $187,666 |
| 2016 | $3,088 | $226,882 | $42,896 | $183,986 |
| 2015 | $2,901 | $223,474 | $42,252 | $181,222 |
| 2014 | -- | $219,096 | $41,424 | $177,672 |
Source: Public Records
Map
Nearby Homes
- 1805 Clemson St
- 4981 N State St
- 4872 Cambridge Ave
- 10 Kendall Dr
- 1951 Provost Ct
- 5370 N Alumni Ln
- 5641 N Pinnacle Ln
- 1559 Wild Pony Path
- 5305 Lilac St
- 1535 Sheridan Rd
- 1548 Teton St
- 1503 Indian Trail
- 5615 Buckboard Dr
- 5205 N Mammoth Dr
- 1511 Yardley St
- 1439 Sheridan Rd
- 2695 Rosarita St
- 2652 Shadow Hills Dr
- 2724 June Place
- 3840 June St
- 5055 Cambridge Ave
- 5075 Cambridge Ave
- 5045 Cambridge Ave
- 5085 Cambridge Ave
- 5074 Cambridge Ave
- 5064 Cambridge Ave
- 5084 Cambridge Ave
- 5054 Cambridge Ave
- 5095 Cambridge Ave
- 5035 Cambridge Ave
- 5094 Cambridge Ave
- 5044 Cambridge Ave
- 5067 N Varsity Ave
- 5077 N Varsity Ave
- 5059 N Varsity Ave
- 5105 Cambridge Ave
- 5025 Cambridge Ave
- 5085 N Varsity Ave
- 5034 Cambridge Ave
- 5049 N Varsity Ave