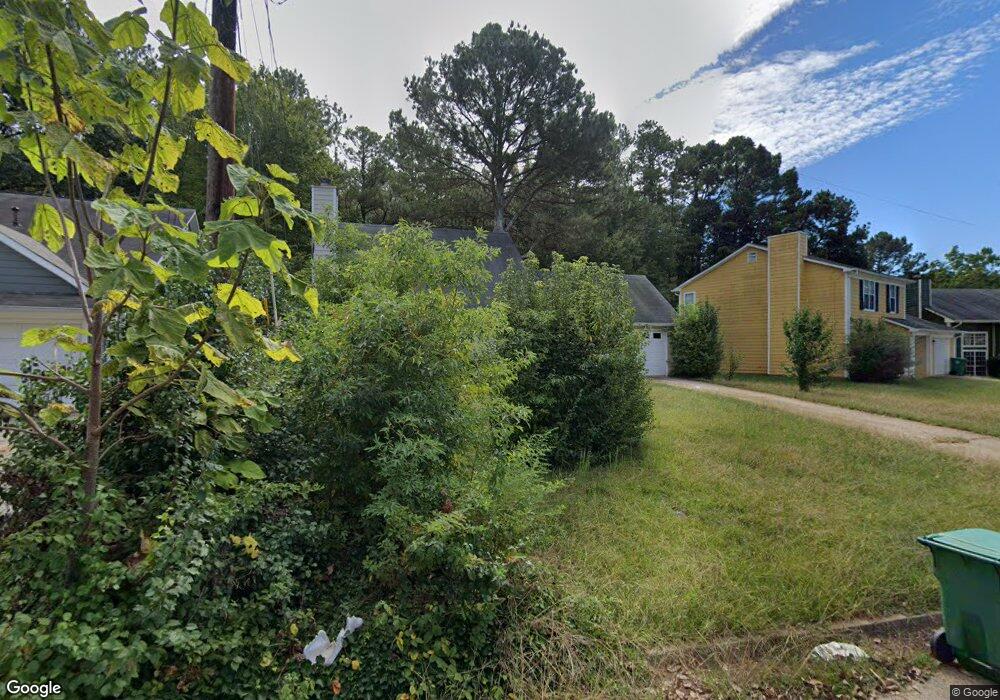
5065 Donnell Way Decatur, GA 30035
Southwest DeKalb NeighborhoodEstimated Value: $220,000 - $265,000
3
Beds
3
Baths
2,379
Sq Ft
$101/Sq Ft
Est. Value
About This Home
This home is located at 5065 Donnell Way, Decatur, GA 30035 and is currently estimated at $241,391, approximately $101 per square foot. 5065 Donnell Way is a home located in DeKalb County with nearby schools including Flat Rock Elementary School, Miller Grove Middle School, and Miller Grove High School.
Ownership History
Date
Name
Owned For
Owner Type
Purchase Details
Closed on
Feb 15, 2019
Sold by
P Fin Ii Llc
Bought by
Pfin Ii F Llc
Current Estimated Value
Purchase Details
Closed on
May 15, 2017
Sold by
Not Provided
Bought by
P Fin Ii Llc
Purchase Details
Closed on
Jun 3, 2014
Sold by
Lewis Ina M
Bought by
Beauly Llc
Purchase Details
Closed on
Jan 30, 2012
Sold by
Lewis Susan C
Bought by
Lewis Ina M
Purchase Details
Closed on
Jul 18, 2008
Sold by
Jacobs Michelle
Bought by
Lewis Ina M and Lewis Susan C
Home Financials for this Owner
Home Financials are based on the most recent Mortgage that was taken out on this home.
Original Mortgage
$129,165
Interest Rate
6.37%
Mortgage Type
FHA
Purchase Details
Closed on
Nov 23, 1993
Sold by
Ruffin Arthur
Bought by
Jacobs Michelle
Home Financials for this Owner
Home Financials are based on the most recent Mortgage that was taken out on this home.
Original Mortgage
$73,900
Interest Rate
9.5%
Mortgage Type
FHA
Create a Home Valuation Report for This Property
The Home Valuation Report is an in-depth analysis detailing your home's value as well as a comparison with similar homes in the area
Home Values in the Area
Average Home Value in this Area
Purchase History
| Date | Buyer | Sale Price | Title Company |
|---|---|---|---|
| Pfin Ii F Llc | -- | -- | |
| P Fin Ii Llc | $11,569,148 | -- | |
| Beauly Llc | $67,100 | -- | |
| Lewis Ina M | -- | -- | |
| Lewis Ina M | -- | -- | |
| Jacobs Michelle | $14,000 | -- |
Source: Public Records
Mortgage History
| Date | Status | Borrower | Loan Amount |
|---|---|---|---|
| Previous Owner | Lewis Ina M | $129,165 | |
| Previous Owner | Jacobs Michelle | $73,900 |
Source: Public Records
Tax History Compared to Growth
Tax History
| Year | Tax Paid | Tax Assessment Tax Assessment Total Assessment is a certain percentage of the fair market value that is determined by local assessors to be the total taxable value of land and additions on the property. | Land | Improvement |
|---|---|---|---|---|
| 2025 | $4,237 | $86,680 | $7,600 | $79,080 |
| 2024 | $4,234 | $86,680 | $7,600 | $79,080 |
| 2023 | $4,234 | $86,680 | $7,600 | $79,080 |
| 2022 | $4,336 | $91,120 | $7,600 | $83,520 |
| 2021 | $3,265 | $66,720 | $3,840 | $62,880 |
| 2020 | $2,818 | $56,520 | $3,840 | $52,680 |
| 2019 | $2,835 | $56,920 | $3,840 | $53,080 |
| 2018 | $2,074 | $44,258 | $3,306 | $40,952 |
| 2017 | $2,169 | $41,560 | $3,840 | $37,720 |
| 2016 | $2,244 | $43,160 | $3,840 | $39,320 |
| 2014 | $563 | $17,880 | $3,840 | $14,040 |
Source: Public Records
Map
Nearby Homes
- 5071 Donnell Way
- 5057 Chadwick Ct
- 5035 Chadwick Ct
- 5042 Chadwick Ct
- 4990 Windsor Downs Dr
- 4969 Truitt Ln Unit 1
- 2322 Wilkins Ct
- 2332 Wilkins Ct Unit 1
- 4987 Hidden Creek Ct
- 2290 Wilkins Cove
- 4915 Truitt Ln Unit 2
- 4963 Windsor Downs Ln
- 2329 Wilkins Cove
- 2333 Wilkins Cove
- 4890 Wilkins Station Dr
- 2306 Ramblewood Cir
- 5061 Donnell Way
- 5075 Donnell Way
- 5059 Donnell Way
- 5070 Donnell Way
- 5070 Donnell Way Unit 5070
- 5062 Donnell Way
- 5078 Donnell Way Unit 1
- 5079 Donnell Way
- 5057 Donnell Way
- 5056 Donnell Way
- 5053 Donnell Way
- 5083 Donnell Way Unit 1
- 5051 Chadwick Ct
- 5050 Donnell Way
- 0 Chadwick Ct
- 5049 Donnell Way
- 5090 Donnell Way
- 5047 Chadwick Ct
- 5087 Donnell Way Unit 1
- 5044 Donnell Way Unit 1