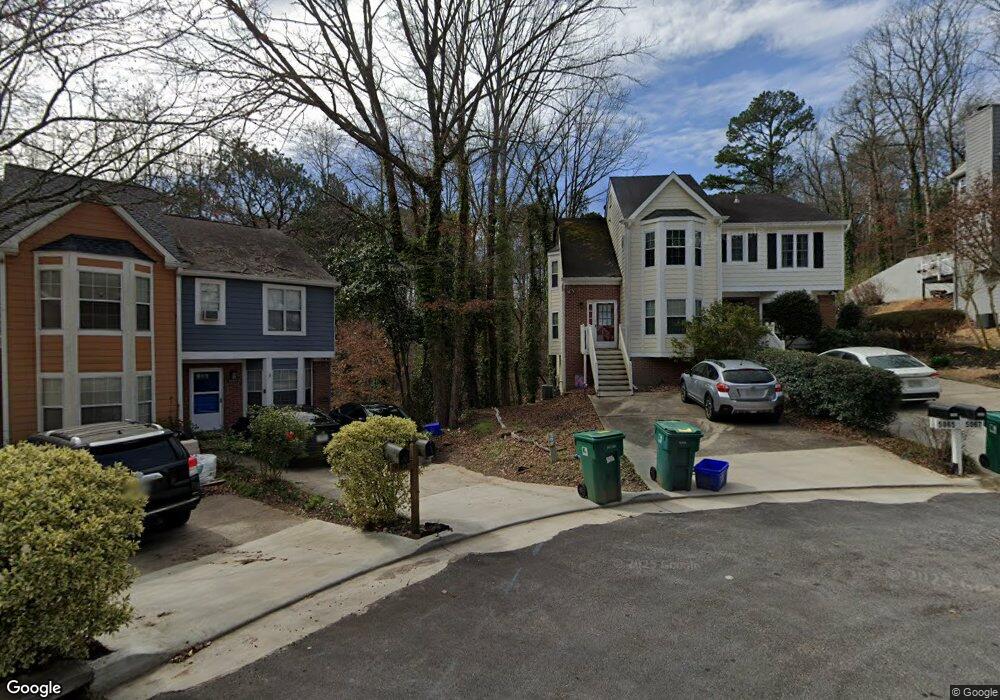
5065 Laurel Springs Way SE Smyrna, GA 30082
Estimated Value: $263,000 - $292,000
2
Beds
2
Baths
1,280
Sq Ft
$218/Sq Ft
Est. Value
About This Home
This home is located at 5065 Laurel Springs Way SE, Smyrna, GA 30082 and is currently estimated at $279,035, approximately $217 per square foot. 5065 Laurel Springs Way SE is a home located in Cobb County with nearby schools including Nickajack Elementary School, Griffin Middle School, and Campbell High School.
Ownership History
Date
Name
Owned For
Owner Type
Purchase Details
Closed on
Aug 13, 2021
Sold by
Lynch Christopher
Bought by
Cochran Amanda Christine
Current Estimated Value
Home Financials for this Owner
Home Financials are based on the most recent Mortgage that was taken out on this home.
Original Mortgage
$207,990
Outstanding Balance
$188,719
Interest Rate
2.9%
Mortgage Type
New Conventional
Estimated Equity
$90,316
Purchase Details
Closed on
Jul 30, 2002
Sold by
Stefanik Jennifer L
Bought by
Lynch Christopher
Home Financials for this Owner
Home Financials are based on the most recent Mortgage that was taken out on this home.
Original Mortgage
$103,600
Interest Rate
5.38%
Mortgage Type
New Conventional
Purchase Details
Closed on
Feb 10, 1999
Sold by
Price Anne
Bought by
Stefanik Jennifer L
Home Financials for this Owner
Home Financials are based on the most recent Mortgage that was taken out on this home.
Original Mortgage
$80,000
Interest Rate
6.84%
Mortgage Type
New Conventional
Create a Home Valuation Report for This Property
The Home Valuation Report is an in-depth analysis detailing your home's value as well as a comparison with similar homes in the area
Home Values in the Area
Average Home Value in this Area
Purchase History
| Date | Buyer | Sale Price | Title Company |
|---|---|---|---|
| Cochran Amanda Christine | $231,100 | None Available | |
| Lynch Christopher | $129,500 | -- | |
| Stefanik Jennifer L | $108,000 | -- |
Source: Public Records
Mortgage History
| Date | Status | Borrower | Loan Amount |
|---|---|---|---|
| Open | Cochran Amanda Christine | $207,990 | |
| Previous Owner | Lynch Christopher | $103,600 | |
| Previous Owner | Stefanik Jennifer L | $80,000 |
Source: Public Records
Tax History Compared to Growth
Tax History
| Year | Tax Paid | Tax Assessment Tax Assessment Total Assessment is a certain percentage of the fair market value that is determined by local assessors to be the total taxable value of land and additions on the property. | Land | Improvement |
|---|---|---|---|---|
| 2025 | $2,353 | $105,084 | $24,000 | $81,084 |
| 2024 | $2,353 | $105,084 | $24,000 | $81,084 |
| 2023 | $1,645 | $93,392 | $20,000 | $73,392 |
| 2022 | $1,858 | $77,916 | $20,000 | $57,916 |
| 2021 | $2,142 | $77,916 | $20,000 | $57,916 |
| 2020 | $1,778 | $64,664 | $18,000 | $46,664 |
| 2019 | $1,708 | $62,120 | $18,000 | $44,120 |
| 2018 | $1,678 | $61,040 | $16,000 | $45,040 |
| 2017 | $1,121 | $43,464 | $7,200 | $36,264 |
| 2016 | $988 | $38,324 | $8,000 | $30,324 |
| 2015 | $783 | $29,668 | $7,200 | $22,468 |
| 2014 | $791 | $29,668 | $0 | $0 |
Source: Public Records
Map
Nearby Homes
- 5033 David Place SE
- 5188 Laurel Bridge Ct SE
- 1292 Creekside Terrace SE
- 1286 Creekside Terrace SE
- 1266 Creekside Terrace SE
- 1222 Creekside Place SE
- 1631 Wehunt Place SE Unit 14
- 2158 Berryhill Cir SE
- 308 Holbrook Rd Unit 11
- 2163 Berryhill Cir SE
- 4644 Wehunt Commons Dr SE Unit 31
- 109 Wetherbrooke Ln
- 1554 Cooper Lake Rd SE
- 1529 Slopeside Loop SE
- 4781 Highside Way SE
- 0 Gaylor St Unit 10203409
- 0 Gaylor St Unit 7275195
- 4368 Laurel Cir SE
- 5067 Laurel Springs Way SE
- 5069 Laurel Springs Way SE
- 5063 Laurel Springs Way SE
- 5071 Laurel Springs Way SE
- 5059 Laurel Springs Way SE
- 5059 Laurel Springs Way SE Unit 56
- 5057 Laurel Springs Way SE
- 5070 Laurel Glen Ct SE
- 5072 Laurel Glen Ct SE
- 5055 Laurel Springs Way SE Unit 1268
- 5055 Laurel Springs Way SE
- 5076 Laurel Glen Ct SE
- 5047 Laurel Springs Way SE
- 5074 Laurel Glen Ct SE
- 5061 Laurel Springs Way SE
- 5049 Laurel Springs Way SE
- 5051 Laurel Springs Way SE
- 5053 Laurel Springs Way SE
- 5045 Laurel Springs Way SE
- 5043 Laurel Springs Way SE