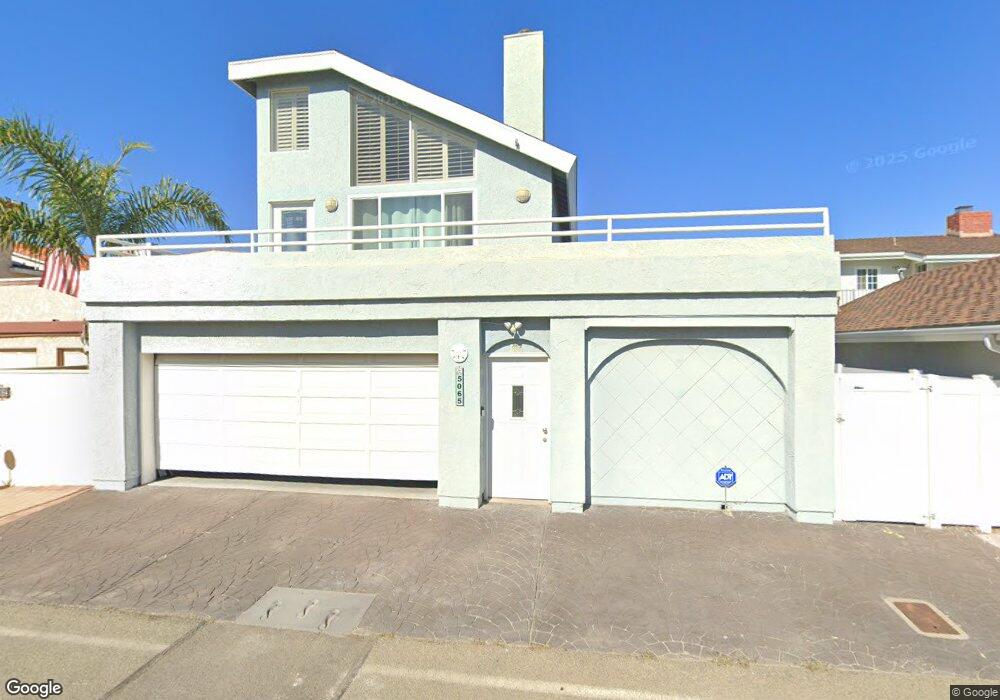
5065 Sealane Way Oxnard, CA 93035
Oxnard Shores NeighborhoodEstimated Value: $1,305,000 - $1,524,000
3
Beds
2
Baths
2,199
Sq Ft
$645/Sq Ft
Est. Value
About This Home
This home is located at 5065 Sealane Way, Oxnard, CA 93035 and is currently estimated at $1,417,728, approximately $644 per square foot. 5065 Sealane Way is a home located in Ventura County with nearby schools including Christa Mcauliffe Elementary School and Oxnard High School.
Ownership History
Date
Name
Owned For
Owner Type
Purchase Details
Closed on
Nov 16, 2022
Sold by
Boyle Lynne B
Bought by
Boyle Lynne B
Current Estimated Value
Purchase Details
Closed on
May 15, 2015
Sold by
Austad Kjell and Austad Nancy
Bought by
Boyle William Brian and Boyle Lynne Barbara
Home Financials for this Owner
Home Financials are based on the most recent Mortgage that was taken out on this home.
Original Mortgage
$395,000
Interest Rate
3.62%
Mortgage Type
New Conventional
Purchase Details
Closed on
Sep 30, 1998
Sold by
Erickson Gary E and Erickson Gary
Bought by
Austad Kjell and Austad Nancy
Home Financials for this Owner
Home Financials are based on the most recent Mortgage that was taken out on this home.
Original Mortgage
$60,000
Interest Rate
6.86%
Purchase Details
Closed on
Jun 11, 1998
Sold by
Erickson Laura L
Bought by
Erickson Gary
Create a Home Valuation Report for This Property
The Home Valuation Report is an in-depth analysis detailing your home's value as well as a comparison with similar homes in the area
Home Values in the Area
Average Home Value in this Area
Purchase History
| Date | Buyer | Sale Price | Title Company |
|---|---|---|---|
| Boyle Lynne B | -- | None Listed On Document | |
| Boyle William Brian | $735,000 | Equity Title | |
| Austad Kjell | $352,500 | Chicago Title Co | |
| Erickson Gary | -- | -- |
Source: Public Records
Mortgage History
| Date | Status | Borrower | Loan Amount |
|---|---|---|---|
| Previous Owner | Boyle William Brian | $395,000 | |
| Previous Owner | Austad Kjell | $60,000 |
Source: Public Records
Tax History Compared to Growth
Tax History
| Year | Tax Paid | Tax Assessment Tax Assessment Total Assessment is a certain percentage of the fair market value that is determined by local assessors to be the total taxable value of land and additions on the property. | Land | Improvement |
|---|---|---|---|---|
| 2025 | $10,598 | $883,349 | $574,478 | $308,871 |
| 2024 | $10,598 | $866,029 | $563,214 | $302,815 |
| 2023 | $10,209 | $849,049 | $552,171 | $296,878 |
| 2022 | $9,899 | $832,401 | $541,344 | $291,057 |
| 2021 | $9,818 | $816,080 | $530,730 | $285,350 |
| 2020 | $10,001 | $807,714 | $525,289 | $282,425 |
| 2019 | $9,716 | $791,878 | $514,990 | $276,888 |
| 2018 | $9,578 | $776,352 | $504,893 | $271,459 |
| 2017 | $9,087 | $761,131 | $494,994 | $266,137 |
| 2016 | $8,766 | $746,208 | $485,289 | $260,919 |
| 2015 | $5,097 | $424,573 | $234,788 | $189,785 |
| 2014 | -- | $416,258 | $230,190 | $186,068 |
Source: Public Records
Map
Nearby Homes
- 1230 Mandalay Beach Rd
- 5125 W Wooley Rd Unit 5
- 4940 Dunes St
- 4906 Dunes St
- 5121 Breakwater Way
- 1020 Dunes St
- 1068 Canal St
- 1410 Marine Way
- 5113 Whitecap St
- 1235 Capri Way
- 1211 Capri Way
- 1417 Marine Way
- 1135 Capri Way
- 5244 Whitecap St
- 920 Catamaran St
- 911 Dunes St
- 4911 Oceanaire St
- 4844 Oceanaire St
- 4941 Catamaran St
- 5245 Seabreeze Way
- 5057 Sealane Way
- 5105 Sealane Way
- 5051 Sealane Way
- 5034 Terramar Way
- 5045 Sealane Way
- 5117 Sealane Way
- 5046 Terramar Way
- 5100 Sealane Way
- 5030 Terramar Way
- 5060 Sealane Way
- 23 Lot Sealane Way
- 5106 Sealane Way
- 5054 Sealane Way
- 5517 Terramar Way
- 5517 Terramar Way Unit 1
- 5050 Terramar Way
- 5024 Terramar Way
- 5112 Sealane Way
- 5039 Sealane Way
- 5121 Sealane Way