5066 Mosiman Rd Middletown, OH 45042
Madison Township NeighborhoodEstimated Value: $264,000 - $280,000
3
Beds
2
Baths
1,230
Sq Ft
$221/Sq Ft
Est. Value
About This Home
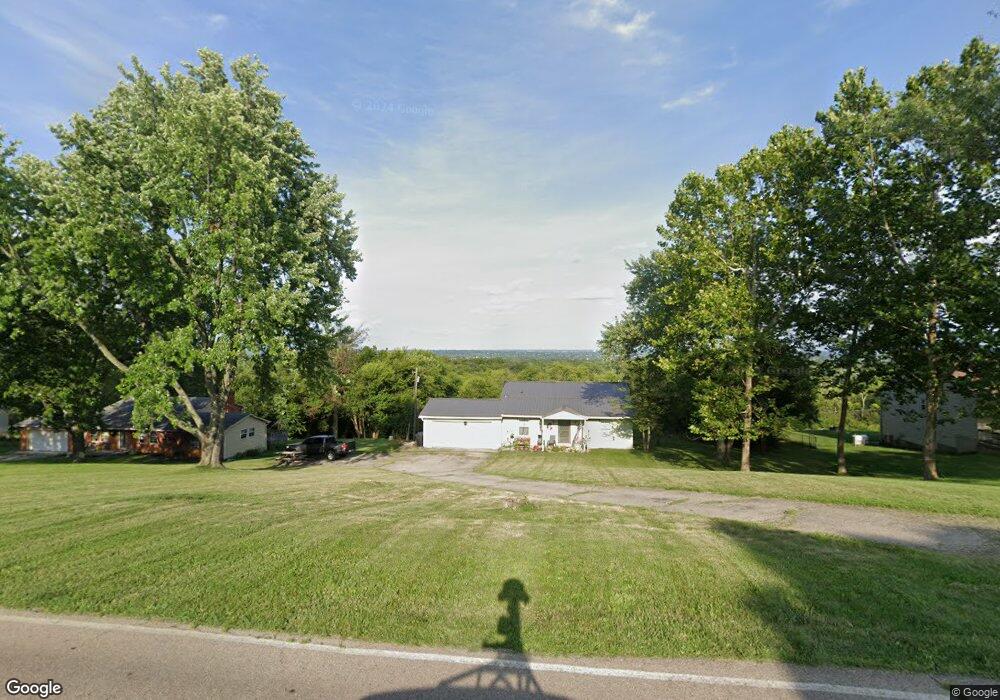
This home is located at 5066 Mosiman Rd, Middletown, OH 45042 and is currently estimated at $272,360, approximately $221 per square foot. 5066 Mosiman Rd is a home located in Butler County with nearby schools including Madison High School.
Ownership History
Date
Name
Owned For
Owner Type
Purchase Details
Closed on
Feb 29, 2016
Sold by
Russell Roandl K
Bought by
Merema Carina and Russell Carinan
Current Estimated Value
Purchase Details
Closed on
Aug 11, 2009
Sold by
Manke Bruce D and Manke Christine E
Bought by
Russell Cariann
Home Financials for this Owner
Home Financials are based on the most recent Mortgage that was taken out on this home.
Original Mortgage
$122,100
Outstanding Balance
$79,934
Interest Rate
5.29%
Mortgage Type
FHA
Estimated Equity
$192,426
Purchase Details
Closed on
Dec 9, 2008
Sold by
Hill Paul D and Hill Shirley
Bought by
Manke Bruce D and Manke Christine E
Purchase Details
Closed on
May 13, 1997
Sold by
Kalmus P Larry
Bought by
Hill Paul D and Hill Shirley
Home Financials for this Owner
Home Financials are based on the most recent Mortgage that was taken out on this home.
Original Mortgage
$111,750
Interest Rate
8.05%
Mortgage Type
FHA
Create a Home Valuation Report for This Property
The Home Valuation Report is an in-depth analysis detailing your home's value as well as a comparison with similar homes in the area
Home Values in the Area
Average Home Value in this Area
Purchase History
| Date | Buyer | Sale Price | Title Company |
|---|---|---|---|
| Merema Carina | -- | None Available | |
| Russell Cariann | $130,000 | Attorney | |
| Manke Bruce D | $130,000 | Attorney | |
| Hill Paul D | $112,000 | -- |
Source: Public Records
Mortgage History
| Date | Status | Borrower | Loan Amount |
|---|---|---|---|
| Open | Russell Cariann | $122,100 | |
| Previous Owner | Hill Paul D | $111,750 |
Source: Public Records
Tax History Compared to Growth
Tax History
| Year | Tax Paid | Tax Assessment Tax Assessment Total Assessment is a certain percentage of the fair market value that is determined by local assessors to be the total taxable value of land and additions on the property. | Land | Improvement |
|---|---|---|---|---|
| 2024 | $3,229 | $78,730 | $13,380 | $65,350 |
| 2023 | $3,206 | $78,730 | $13,380 | $65,350 |
| 2022 | $2,491 | $52,940 | $13,380 | $39,560 |
| 2021 | $2,233 | $52,940 | $13,380 | $39,560 |
| 2020 | $2,322 | $52,940 | $13,380 | $39,560 |
| 2019 | $1,862 | $39,290 | $13,380 | $25,910 |
| 2018 | $1,864 | $39,290 | $13,380 | $25,910 |
| 2017 | $1,863 | $39,290 | $13,380 | $25,910 |
| 2016 | $1,790 | $36,550 | $13,380 | $23,170 |
| 2015 | $1,814 | $36,550 | $13,380 | $23,170 |
| 2014 | $2,112 | $36,550 | $13,380 | $23,170 |
| 2013 | $2,112 | $43,210 | $13,380 | $29,830 |
Source: Public Records
Map
Nearby Homes
- 5386 Mosiman Rd
- 4750 Eck Rd
- 6250 Howe Rd
- 881 Middletown Eaton Rd
- 6423 Howe Rd
- 4348 Elk Creek Rd
- 4510 Trenton Franklin Rd
- 4849 Trenton Franklin Rd
- 1675 Middletown Eaton Rd
- Charleston II Plan at Maple View
- Bayview I Plan at Maple View
- Bayview II Plan at Maple View
- Springfield Plan at Maple View
- Baybrook Plan at Maple View
- Savannah Plan at Maple View
- Augusta Plan at Maple View
- Abbott Plan at Maple View
- 547 Chatham Place
- 540 Chatham Place
- Welshire Plan at Maple View - Maple View Elk Creek
- 5070 Mosiman Rd
- 5062 Mosiman Rd
- 5074 Mosiman Rd
- 5058 Mosiman Rd
- 5078 Mosiman Rd
- 5054 Mosiman Rd
- 5065 Mosiman Rd
- 5067 Mosiman Rd
- 6291 Moder Ln
- 5069 Mosiman Rd
- 5048 Mosiman Rd
- 5084 Mosiman Rd
- 5053 Mosiman Rd
- 5071 Mosiman Rd
- 5041 Mosiman Rd
- 5073 Mosiman Rd
- 5040 Mosiman Rd
- 5086 Mosiman Rd
- 6300 Moder Ln
- 5039 Mosiman Rd