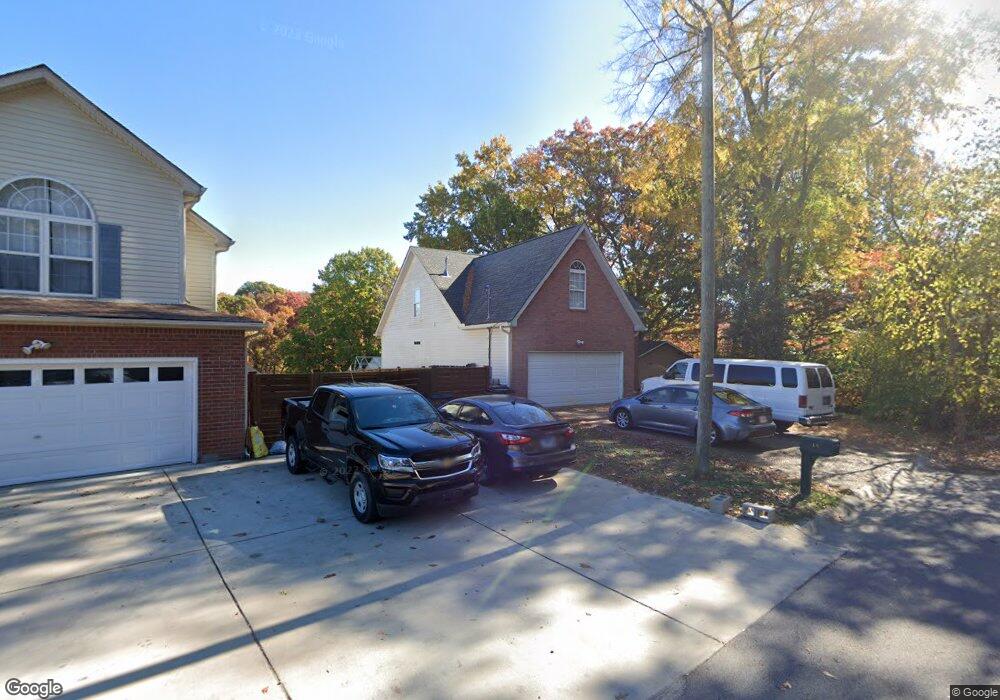
5069 Streamfield Pass Antioch, TN 37013
Estimated Value: $398,000 - $415,207
3
Beds
3
Baths
2,151
Sq Ft
$189/Sq Ft
Est. Value
About This Home
This home is located at 5069 Streamfield Pass, Antioch, TN 37013 and is currently estimated at $407,302, approximately $189 per square foot. 5069 Streamfield Pass is a home located in Davidson County with nearby schools including J.E. Moss Elementary School, Apollo Middle School, and Antioch High School.
Ownership History
Date
Name
Owned For
Owner Type
Purchase Details
Closed on
Jan 15, 2019
Sold by
Dasilva Bertram L and Dasilva Robin
Bought by
Dasilva Lancelot E
Current Estimated Value
Home Financials for this Owner
Home Financials are based on the most recent Mortgage that was taken out on this home.
Original Mortgage
$150,000
Outstanding Balance
$132,147
Interest Rate
4.7%
Mortgage Type
New Conventional
Estimated Equity
$275,155
Purchase Details
Closed on
Feb 18, 2000
Sold by
Jerry Butler Builders Llc
Bought by
Dasilva Bertram L and Dasilva Robin
Home Financials for this Owner
Home Financials are based on the most recent Mortgage that was taken out on this home.
Original Mortgage
$125,280
Interest Rate
8.29%
Mortgage Type
Construction
Create a Home Valuation Report for This Property
The Home Valuation Report is an in-depth analysis detailing your home's value as well as a comparison with similar homes in the area
Home Values in the Area
Average Home Value in this Area
Purchase History
| Date | Buyer | Sale Price | Title Company |
|---|---|---|---|
| Dasilva Lancelot E | $240,000 | Nashville Title Ins Corp | |
| Dasilva Bertram L | $156,600 | Guaranty Title & Escrow Co | |
| Jerry Butler Builders Llc | -- | Guaranty Title & Escrow Co |
Source: Public Records
Mortgage History
| Date | Status | Borrower | Loan Amount |
|---|---|---|---|
| Open | Dasilva Lancelot E | $150,000 | |
| Previous Owner | Jerry Butler Builders Llc | $125,280 | |
| Previous Owner | Dasilva Bertram L | $153,900 |
Source: Public Records
Tax History Compared to Growth
Tax History
| Year | Tax Paid | Tax Assessment Tax Assessment Total Assessment is a certain percentage of the fair market value that is determined by local assessors to be the total taxable value of land and additions on the property. | Land | Improvement |
|---|---|---|---|---|
| 2024 | $2,219 | $68,200 | $10,750 | $57,450 |
| 2023 | $2,219 | $68,200 | $10,750 | $57,450 |
| 2022 | $2,219 | $68,200 | $10,750 | $57,450 |
| 2021 | $2,242 | $68,200 | $10,750 | $57,450 |
| 2020 | $1,972 | $46,725 | $7,750 | $38,975 |
| 2019 | $1,474 | $46,725 | $7,750 | $38,975 |
| 2018 | $1,474 | $46,725 | $7,750 | $38,975 |
| 2017 | $1,474 | $46,725 | $7,750 | $38,975 |
| 2016 | $1,920 | $42,525 | $6,250 | $36,275 |
| 2015 | $1,920 | $42,525 | $6,250 | $36,275 |
| 2014 | $1,920 | $42,525 | $6,250 | $36,275 |
Source: Public Records
Map
Nearby Homes
- 5012 Pebble Creek Dr
- 2616 Mountain Laurel Dr
- 2633 Welshcrest Dr
- 2544 Johnson Ridge Rd
- 708 Richards Rd
- 2520 Johnson Ridge Rd
- 1515 Bridgecrest Dr Unit 408
- 1417 Sweet Shrub Loop Unit 1423D
- 1421 Sweet Shrub Loop Unit 1423B
- 1405 Sweet Shrub Loop
- 1407 Sweet Shrub Loop
- 1401 Sweet Shrub Loop
- 1409 Sweet Shrub Loop
- 1411 Sweet Shrub Loop
- 4836 Barclay Square Dr
- 905 Septo Ct
- 4751 Bowfield Dr
- 117 Apollo Ct W
- 528 Pippin Dr Unit 99
- 520 Pippin Dr
- 5065 Streamfield Pass
- 1904 Streamfield Ct
- 1908 Streamfield Ct
- 1912 Streamfield Ct
- 5048 Streamfield Pass
- 1905 Streamfield Ct
- 5061 Streamfield Pass
- 5044 Streamfield Pass
- 1916 Streamfield Ct
- 1909 Streamfield Ct
- 1913 Streamfield Ct
- 1920 Streamfield Ct
- 5057 Streamfield Pass
- 1601 Buckhorn Trail
- 1917 Streamfield Ct
- 1924 Streamfield Ct
- 5053 Streamfield Pass
- 5049 Streamfield Pass
- 1605 Buckhorn Trail
- 1921 Streamfield Ct