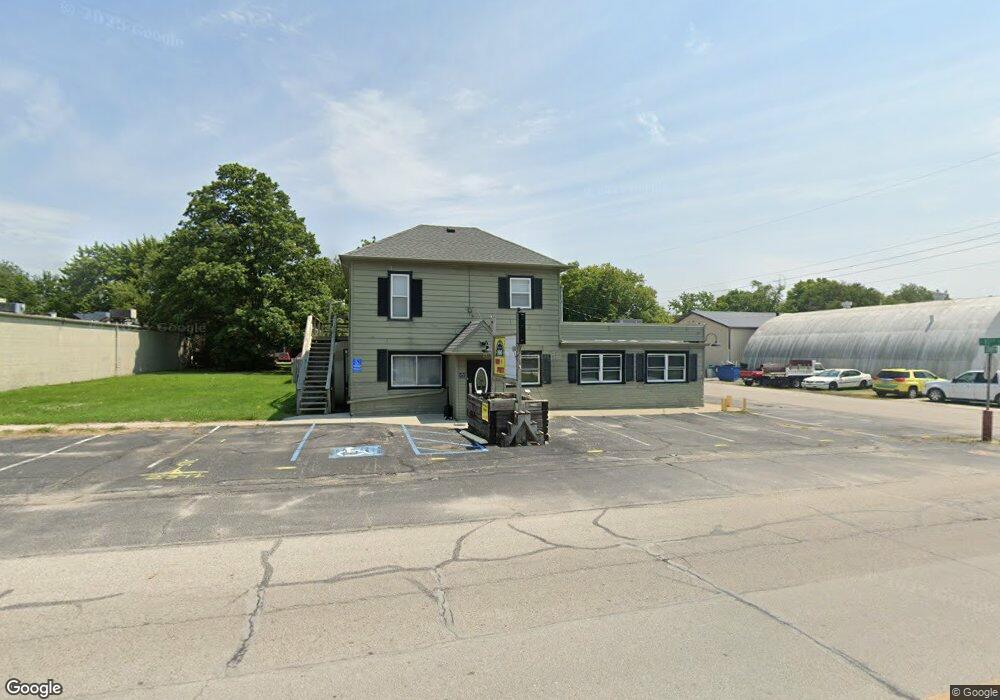
507 & 505 S Grant Ave Fowler, IN 47944
Estimated Value: $289,100
2
Beds
6
Baths
4,126
Sq Ft
$70/Sq Ft
Est. Value
About This Home
This home is located at 507 & 505 S Grant Ave, Fowler, IN 47944 and is currently priced at $289,100, approximately $70 per square foot. 507 & 505 S Grant Ave is a home located in Benton County with nearby schools including Benton Central Junior/Senior High School and Sacred Heart Elementary School.
Ownership History
Date
Name
Owned For
Owner Type
Purchase Details
Closed on
Jan 8, 2025
Sold by
Jrd Investments Llc
Bought by
100 House Llc
Current Estimated Value
Purchase Details
Closed on
Dec 5, 2024
Sold by
Lac Deluxe Llc
Bought by
Jrd Investments Llc
Purchase Details
Closed on
Oct 25, 2022
Sold by
Hundy Corporation
Bought by
Lac Deluxe Llc
Home Financials for this Owner
Home Financials are based on the most recent Mortgage that was taken out on this home.
Original Mortgage
$207,500
Interest Rate
6.92%
Mortgage Type
New Conventional
Purchase Details
Closed on
Jun 11, 1997
Sold by
Not Provided
Bought by
Not Provided
Create a Home Valuation Report for This Property
The Home Valuation Report is an in-depth analysis detailing your home's value as well as a comparison with similar homes in the area
Home Values in the Area
Average Home Value in this Area
Purchase History
| Date | Buyer | Sale Price | Title Company |
|---|---|---|---|
| 100 House Llc | -- | None Listed On Document | |
| 100 House Llc | -- | None Listed On Document | |
| Jrd Investments Llc | -- | Meridian Title | |
| Jrd Investments Llc | -- | Meridian Title | |
| Lac Deluxe Llc | -- | -- | |
| Not Provided | $90,000 | -- |
Source: Public Records
Mortgage History
| Date | Status | Borrower | Loan Amount |
|---|---|---|---|
| Previous Owner | Lac Deluxe Llc | $207,500 |
Source: Public Records
Tax History Compared to Growth
Tax History
| Year | Tax Paid | Tax Assessment Tax Assessment Total Assessment is a certain percentage of the fair market value that is determined by local assessors to be the total taxable value of land and additions on the property. | Land | Improvement |
|---|---|---|---|---|
| 2024 | $2,798 | $104,000 | $40,100 | $63,900 |
| 2023 | $3,011 | $104,700 | $40,100 | $64,600 |
| 2022 | $3,245 | $107,500 | $40,100 | $67,400 |
| 2021 | $3,217 | $101,800 | $40,100 | $61,700 |
| 2020 | $2,910 | $96,900 | $40,100 | $56,800 |
| 2019 | $2,651 | $93,200 | $34,800 | $58,400 |
| 2018 | $2,667 | $93,800 | $34,800 | $59,000 |
| 2017 | $2,538 | $89,100 | $34,800 | $54,300 |
| 2016 | $2,381 | $83,400 | $34,800 | $48,600 |
| 2014 | $2,003 | $70,600 | $27,300 | $43,300 |
| 2013 | $2,003 | $68,300 | $26,500 | $41,800 |
Source: Public Records
Map
Nearby Homes
- 902 E 8th St
- 1003 E 11th St
- 909 E 8th St
- 1010 E 8th St
- 909 E 7th St
- 201 S Grant Ave
- 501 E 7th St
- 602 S Park Dr
- 206 S Van Buren Ave
- 1209 E 13th St
- 1009 E 4th St
- 403 E 4th St
- 909 E 3rd St
- 305 N Lincoln Ave
- 202 N Van Buren Ave
- 205 N Madison Ave
- 307 N Madison Ave
- 202 N Washington Ave
- 307 N Washington Ave
- 703 W 2nd St